

Overview
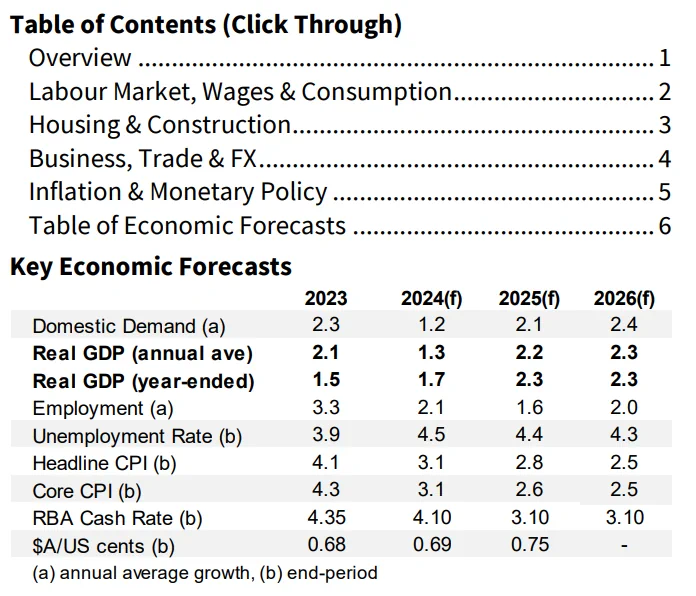
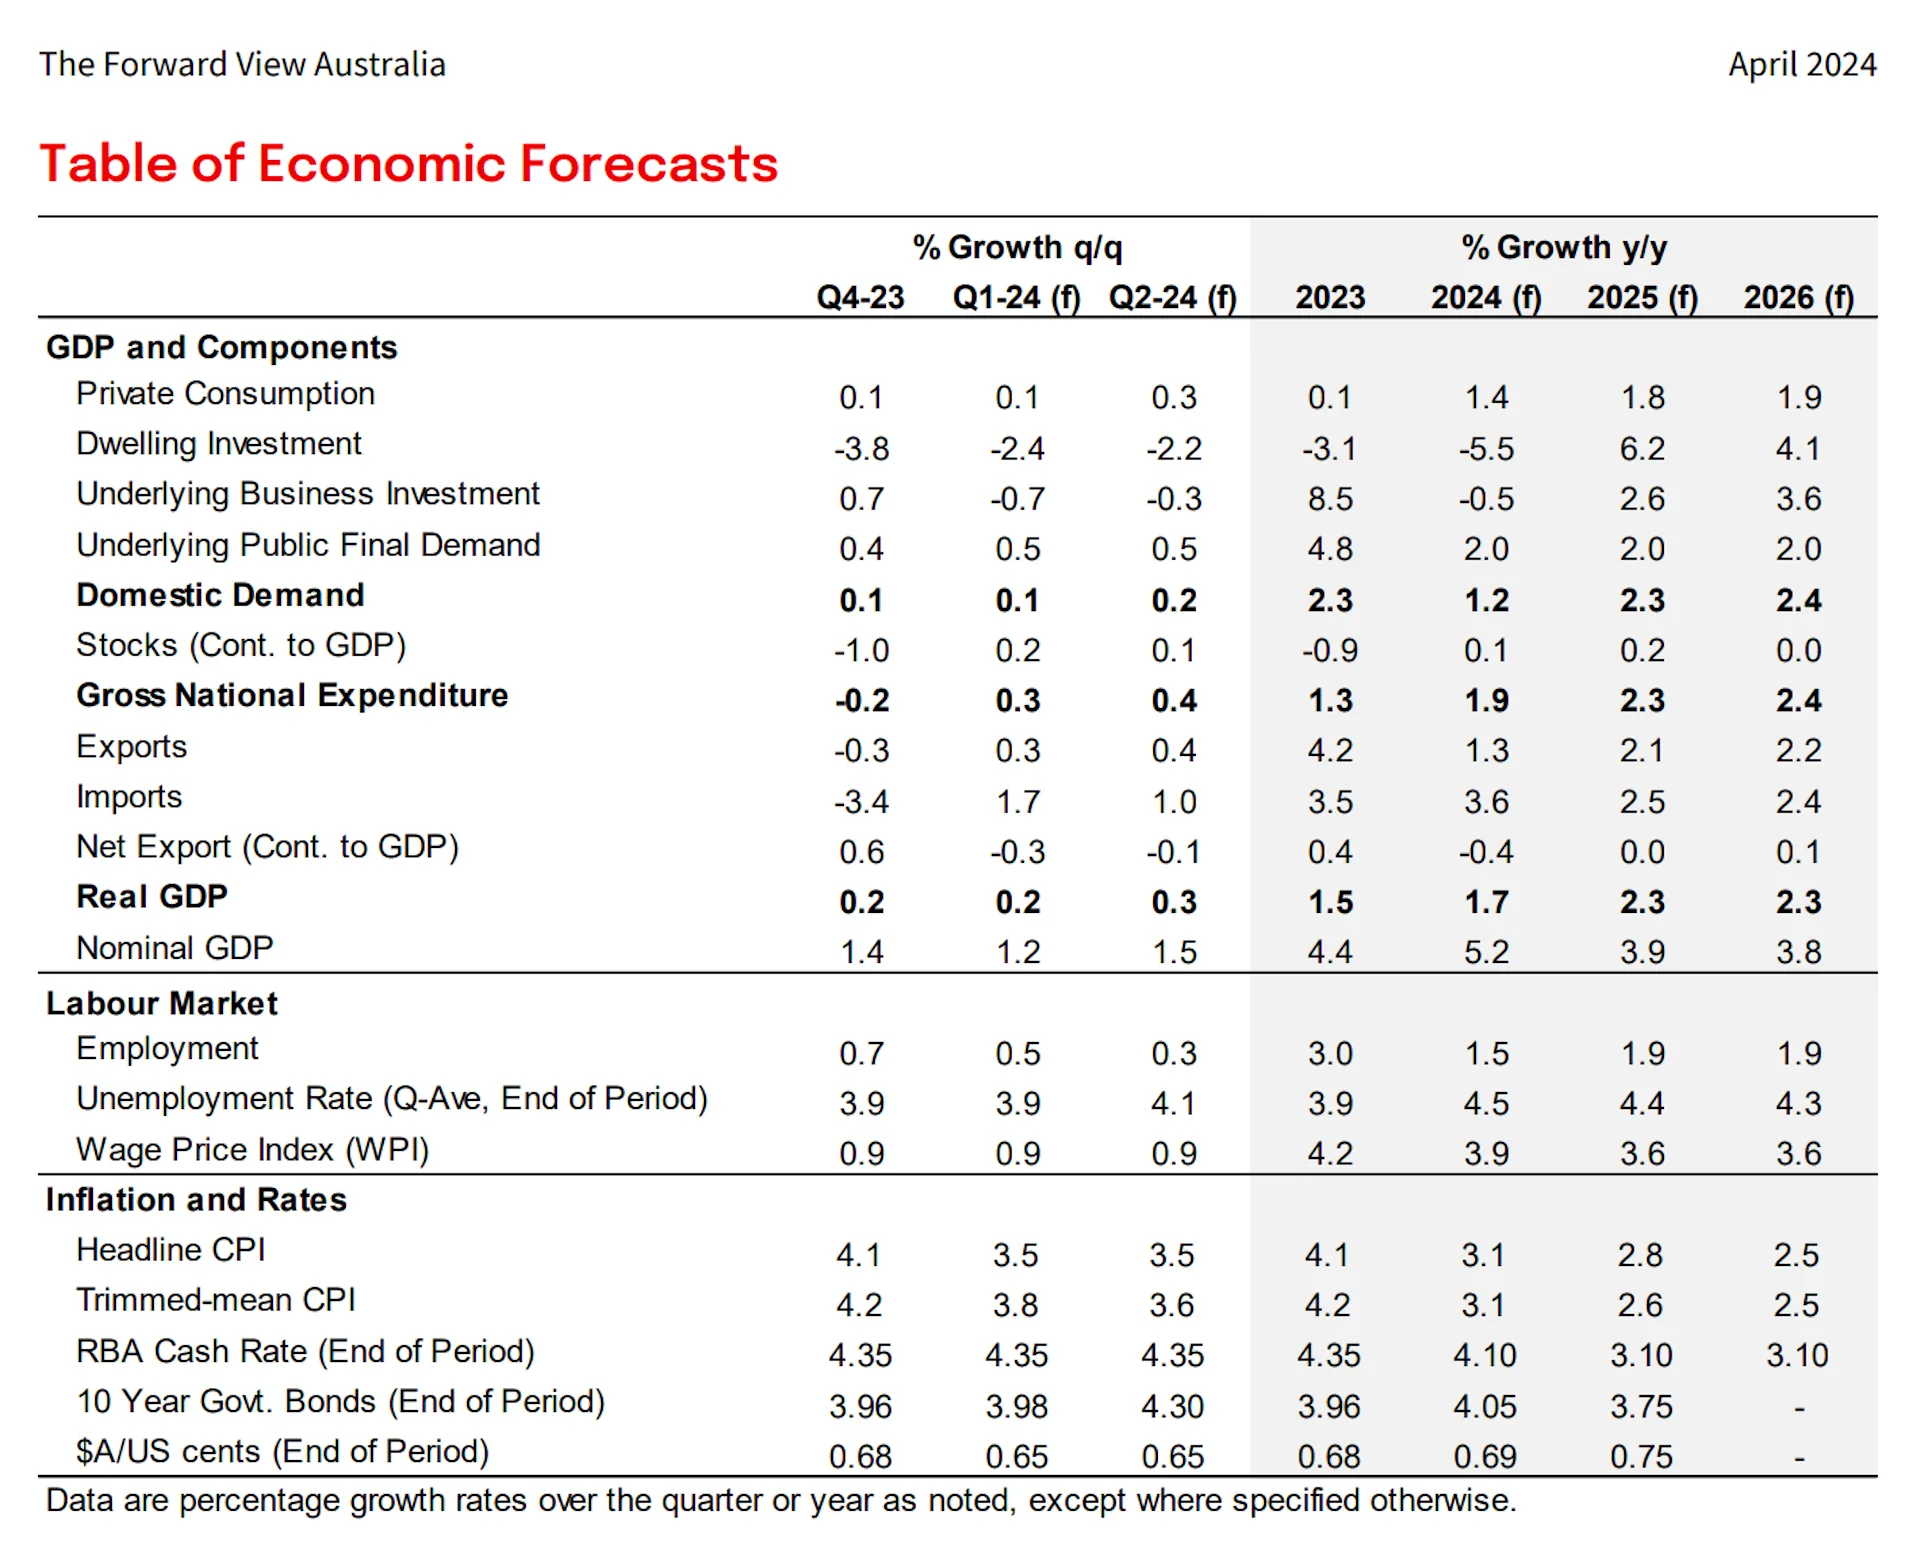
- With few major data releases in the past month our forecasts remain largely unchanged, with subdued growth still the order of the day. Overall, we continue to expect GDP growth of 1.7% for 2024, improving to around a trend rate of 2¼ % in 2025 and 2026.
- That said, the underlying strength of the labour market and the pace of easing in inflation are both in focus with key data releases due in the coming weeks ahead of the May RBA Board meeting (where we expect rates to remain on hold) and the Federal Budget.
- On the labour market, a very strong February print (in part reflecting changing seasonality) saw the unemployment rate fall to 3.7%, suggesting the rise in the unemployment rate in late 2023/early 2024 may have been overstated. The March data will be closely watched for confirmation of the underlying strength of employment growth. For now, we still expect the unemployment rate to rise over the course of this year, to around 4½% by end-2024.
- On inflation, we expect the Q1 CPI to show a slight pickup in underlying inflation on a quarterly basis, to 0.9%, though the year-ended number will continue to ease to 3.8%. Rents, insurance and other services remain key drivers and while this will not be out of line with the RBA’s forecasts, more improvement will be needed before a first rate cut, which we continue to expect in November this year.
- Housing also remains a major focus. We expect little progress in easing the supply/demand imbalance with ongoing weakness in new supply despite some easing in population growth. That is expected to continue to support both rents and price growth generally, and present challenges for the cost of living as well as the housing-related components of the CPI.
- Global events are also a feature impacting the outlook for Australia. In addition to geopolitical risks, US inflation reaccelerated over recent months and the labour market remains strong. We now expect the Fed to begin cutting rates from September (previously June). This is likely to extend the period of USD strength, and we have pushed back the timing of an expected appreciation in the Aussie to Q3. Elsewhere, China’s subdued growth outlook has seen iron ore prices decline.
Labour Market, Wages & Consumption
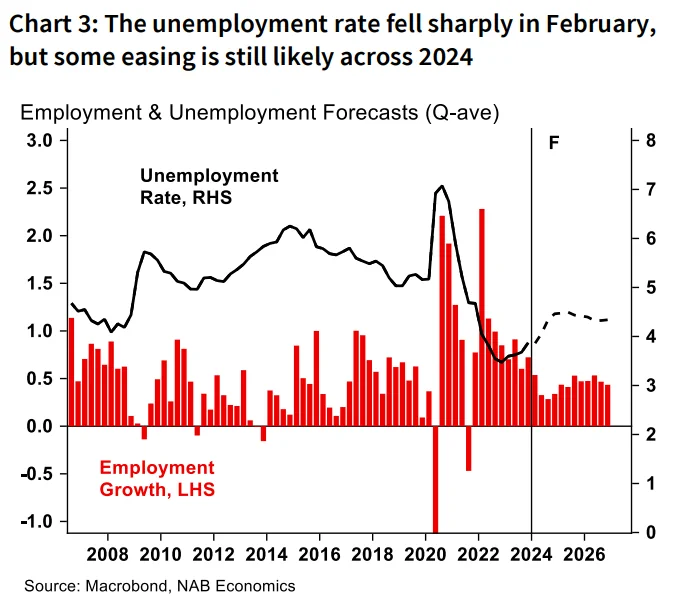
After a sharp fall in the unemployment rate to 3.7% in February, and only modest easing in the vacancy rate, it is clear the labour market remains tight – but the pace of easing from here is a key uncertainty.
A strong rebound in employment was expected in February, but the 116k rise in the month exceeded expectations leaving the unemployment rate only a little above its mid-2023 low point. This suggests the rise in unemployment that appeared to be underway through the second half of 2023 may have only been modest.
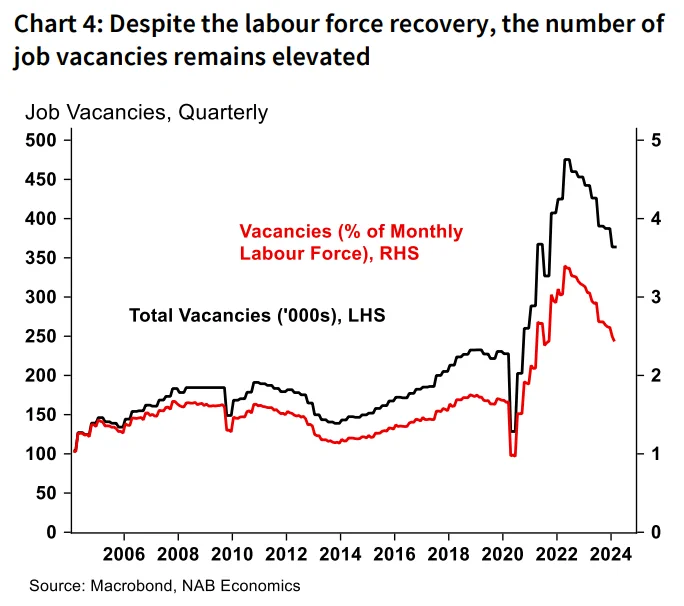
Data on job vacancies in February also reinforced that view, despite the slowing in economic growth over the past year, labour demand remains elevated. While the number of vacancies continued to fall from its mid-2022 peak, they still equate to around 2.4% of the labour force – well above the vacancy rate prior to the pandemic.
The data for March will therefore be closely watched for a clearer read on the underlying pace of labour market easing. We fall in the camp of seeing January’s 4.1% unemployment rate as something of an outlier, with a modest rise from 3.7% to 3.8% our pick. Nonetheless, we
continue to expect further labour market easing over the course of the year ahead as population growth continues to outpace employment growth, and still see the unemployment rate rising to 4½% by year-end.
Further out, the unemployment rate should stabilise
around 4¼-4½% on the back of improving economic
growth and normalising population trends. In turn, this
should limit the scope for further acceleration in
underly
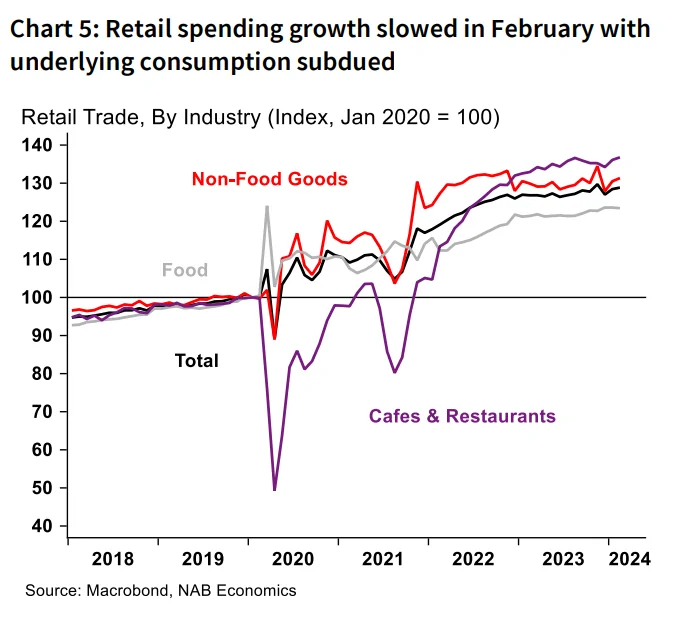
Retail spending growth slowed in February, with consumption growth likely to remain subdued until the second half of the year.
Nominal retail trade rose 0.3% in February after a strong 1.1% increase in January. Growth in the month was driven by clothing & footwear (up 4.2%) and department stores (2.3%) while household goods spending dipped 0.8%. There was also a 0.5% rise in cafes & restaurants, where the overall level of spending remains elevated.
Transaction data in NAB’s Monthly Data Insights report suggested further slowing in spending in March, with seasonally adjusted retail spending growth negative. Still, overall spending remains 1.5% higher across Q1 as a whole, and with inflation easing this suggests at least some positive growth in underlying real consumption – likely slightly stronger than Q4 but still muted. Further ahead, with nominal income growth strong and households set to benefit from easing inflation, tax cuts and (eventually) interest rate cuts, we continue to expect consumption to pick up later in 2024 and into 2025.
Housing & Construction
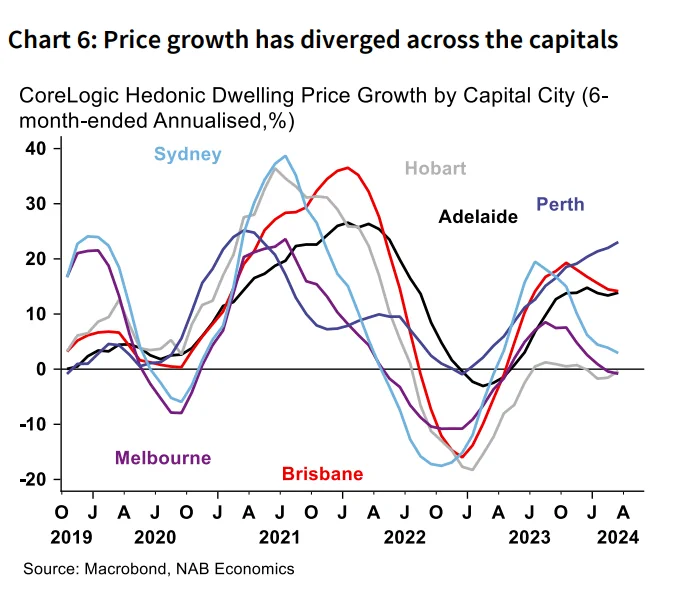
House prices continue to rise, though gains in the smaller mainland capitals continue to outpace the larger cities.
Both the CoreLogic and PropTrack Capital city dwelling price growth may be peaking in annual terms, though overall growth remains solid on a monthly basis.
The trends across the capital cities have also diverged significantly in early 2024. Price growth in Perth remains very strong and continues to accelerate in 6-month annualised terms. Brisbane and Adelaide also continue to see solid gains, though the former has eased off slightly. Price growth in Sydney has lost momentum though is still rising while Melbourne and Hobart have been broadly flat over the past 6 months.
The tightness in the rental market is more uniform across the states with vacancy rates very low compared to historical trends, with Perth and Adelaide still the tightest at just 0.5%, followed by Brisbane at 0.8%. That said, Sydney and Melbourne also remain tight at around 1.0%. Rents growth has reaccelerated over recent months and rose 1.0% in March to be 8.6% higher than a year ago. Rents growth remains strongest in Perth at 14% y/y but is still strong in the remaining capitals which are clustered between 9-10% y/y. Hobart remains the standout with rents declining by 1% over the year consistent with a different trend in rental vacancy rates.
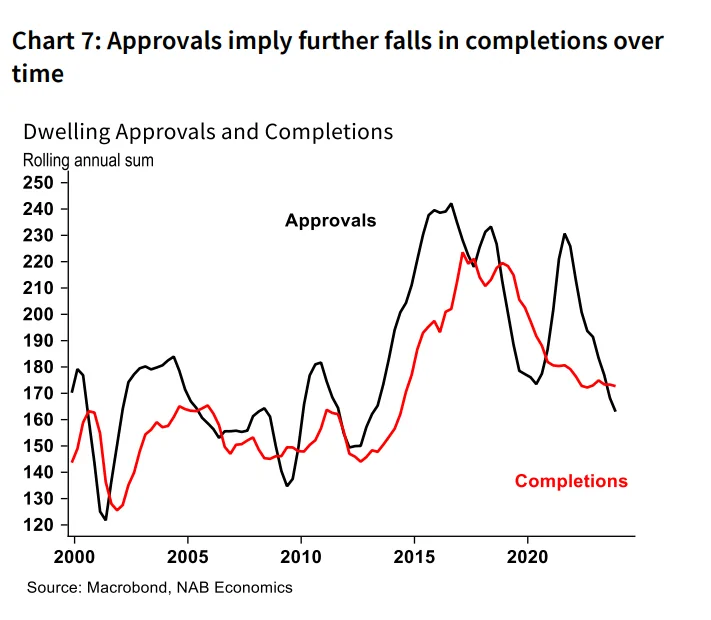
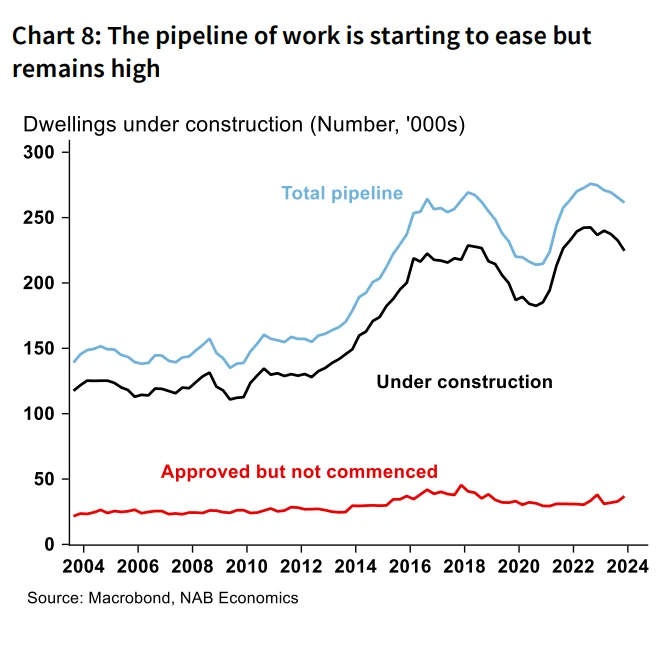
Construction of new homes continues to be challenged
with completions still declining despite an elevated
pipeline of work.
Current rates of population growth imply the need for around 240k+ new dwellings annually, but current completions are around 170k and approvals imply further falls. The outstanding pipeline, equivalent to around 264k dwellings, will support activity but ultimately it is completion rates that matter.
On that front, Building Activity Survey data showed completions continued to decline in Q4 in all states, except for SA and Qld, with annual completion rates tracking at their lowest level since around 2015 in NSW, Vic, Qld. SA completions have tracked broadly sideways. WA has seen an improvement in rolling annual terms and is at its strongest rate since 2015 (after showing a significantly different trend to the other states over the past decade).
With population growth remaining strong (though slowing) and little expectation of an improvement in new supply in the near term we see the supply/demand imbalance persisting for some time. Rate cuts beginning in late 2024 and through 2025 will provide additional support for prices. That said, we expect house prices to continue to track around current rates for the rest of the year – as opposed to the strong growth seen in early 2023 – and see prices across the capitals rising by around 5% on average.
Business, Trade & FX
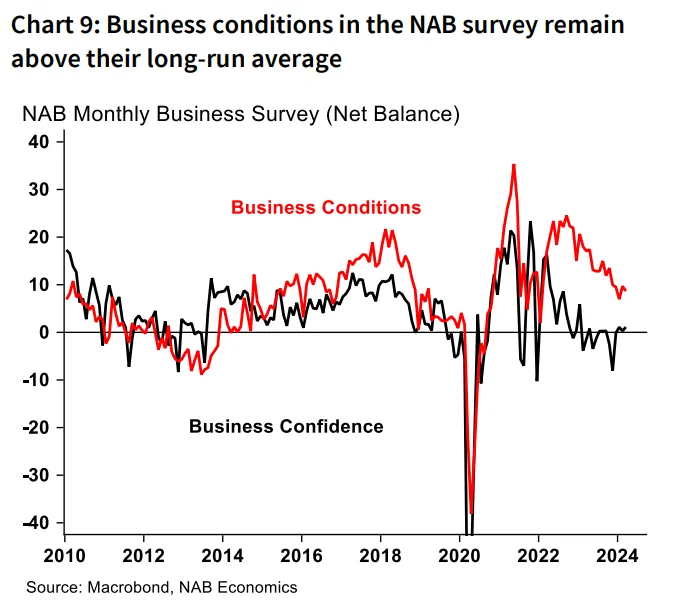
Underlying business investment rose in Q4, while more recently business conditions rose in February.
Headline indicators in the NAB Monthly Business Survey were little changed in March. Conditions fell 1pt but remained above the long-run average at +9 index points, while confidence rose 1pt to +1 index points. This continued the trend of above-average activity indicators alongside below-average confidence that has defined the NAB Business Survey for much of the past year
By industry, there were positive signs for retail and construction which both saw improvement in confidence and conditions in the month, though in trend terms conditions remain weakest in these two rate-exposed sectors. Retail forward orders also rose in the month though in trend terms remain deeply negative.
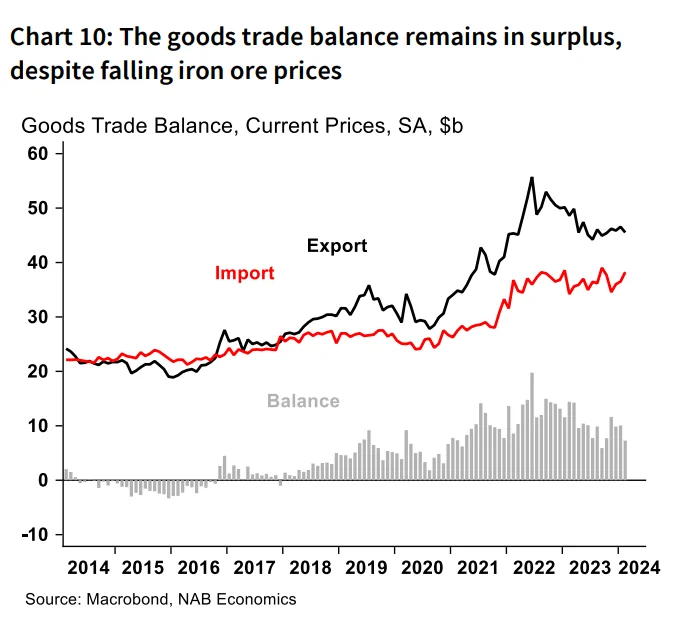
The goods trade balance declined slightly but remained in surplus in February, though some key commodity prices are falling.
Exports fell 2.2% with iron ore export values falling 8.4% in the month, alongside a fall in often-volatile non-monetary gold, partially offset by increases in coal and LNG. Imports also rose in the month.
As covered in our Minerals & Energy Outlook, iron ore spot prices retreated from mid-March onwards, down from around US$125/t at the end of February to be close to US$100/t in early April. The National People’s Congress in China ended hopes of some market participants of largescale stimulus that would boost steel demand, and we see the price falling below US$100/t by end-2024.
LNG prices also dipped in early March before tracking sideways around US$10/mmbtu, while thermal coal prices were steady and met coal moved down. More broadly, global economic growth is set to fall below its long-run trend in 2024 and 2025, reflecting the impact of restrictive monetary policy in advanced economies as well as headwinds to China’s economy. This is likely to negatively impact demand and prices across most energy and metals commodities.
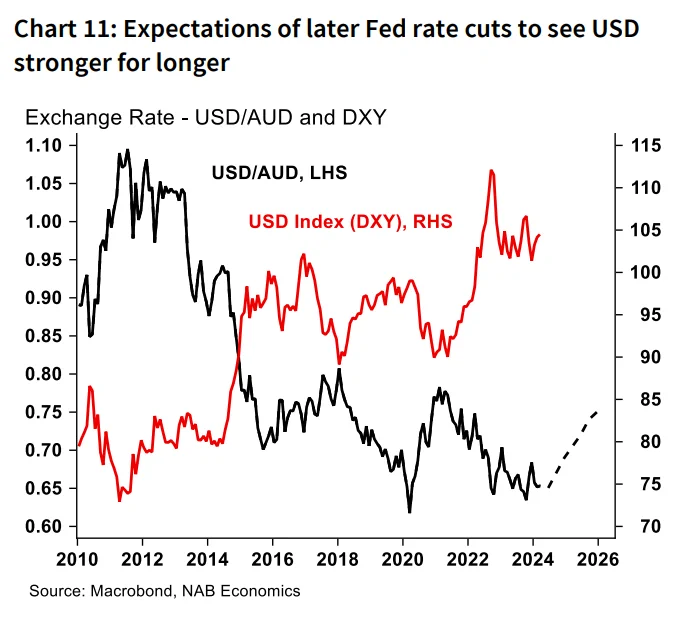
We have lowered our forecast for the AUD/USD on the back of our changes to the outlook for the US economy. We now see the Aussie ending the year around US69c before drifting higher over 2025 – to around US75c.
The Aussie has traded in the US65c range through March/April, coming under pressure as expectations for Fed cuts push out. Therefore, as covered in NAB’s FX Strategy Forecast Update, we have revised our FX forecasts with the USD ‘stronger for longer’ and the expected appreciation in the Aussie pushed out into Q3. Nonetheless, improved global growth should still see some uplift over time.
Inflation & Monetary Policy
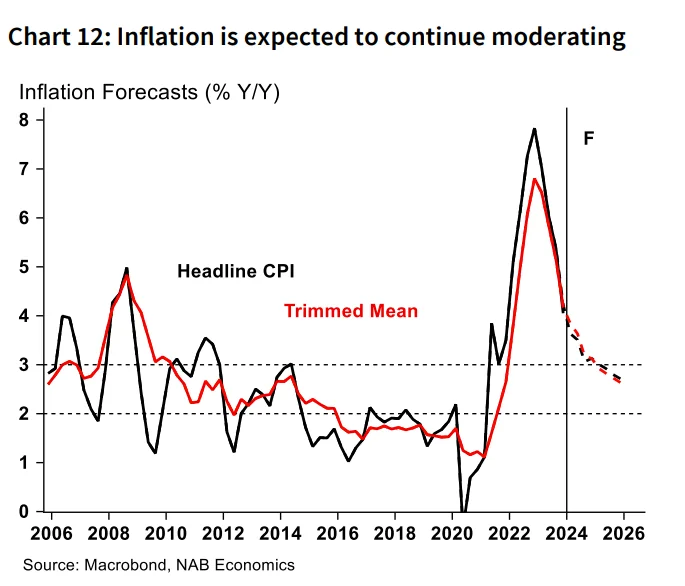
We expect the Q1 CPI print to show quarterly underlying inflation ticked up slightly in early 2024 to 0.9%.
That would see the annual rate continue to ease, falling to 3.8% y/y – now well off its peak of 6.8% in late 2022. Headline CPI is expected to rise 0.8% q/q (3.5% y/y). See our Q1 CPI Preview for more details.
Importantly, that read would be broadly in line with the RBA’s February expectation, allowing them to remain on hold and assess how quickly restrictive policy is bringing inflation back to target.
Further out, we expect gradual easing in inflation pressure, with the annual rate to fall to 3.1% by end 2024 and around 2.6% by end 2025.
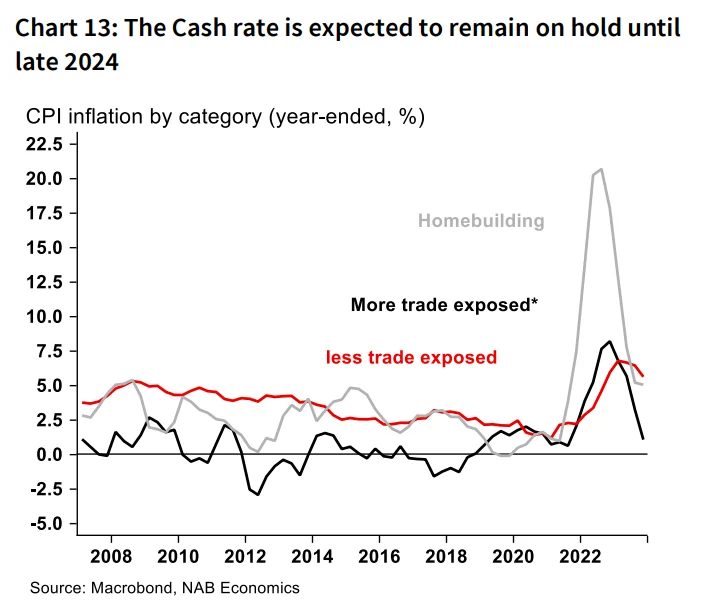
To date, goods disinflation (and deflation in some categories) has been an important driver of overall disinflation while services inflation has remained more challenging. Household rents, insurance, postal services and property rates have all remained elevated, as have
components such as hair dressing and restaurant meals.
While wage costs remain an important factor, for many of these services components there are also other factors at play, and how these resolve will be important.
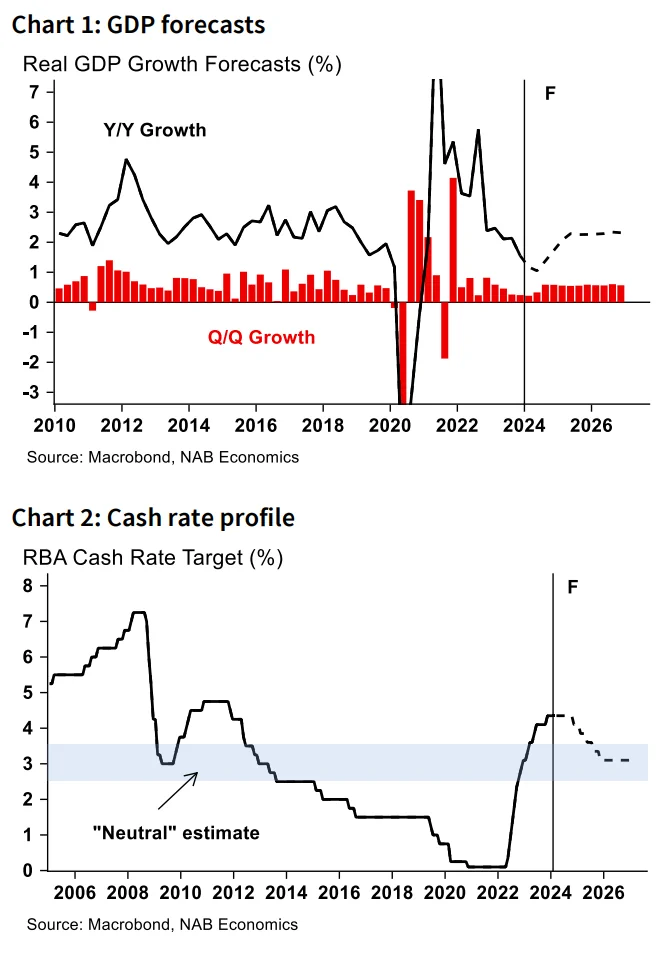
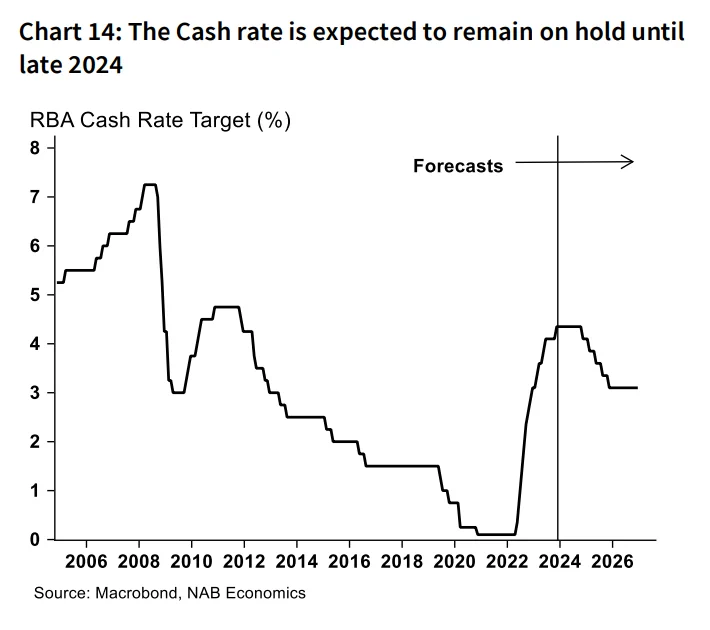
We continue to see the RBA on hold until November before cutting back towards 3.1% over 2025.
By then, we see enough ongoing progress on inflation that the RBA will be comfortable with the projection of a sustainable return to the middle of the target range.
The May meeting will see a full update to the RBA Staff forecasts for activity and inflation. We don’t see a major revision to either aspect of their forecasts with indicators each coming in broadly in line with February SMP projections with the exception of the labour force data.
Overall, we see the RBA as moderately restrictive but for now still able to return inflation to target without a more significant pull-back in economic activity. That said, risks likely remain to the upside on the trajectory of our inflation forecasts.
Services inflation will remain a key focus in so far as it reflects the domestic underlying pressure, in part reflecting a larger labour cost component. A strong starting point for wage growth and a still tight labour market present an upside risk. That said, there are many moving parts within the services component – including significant non-wage pressures from overheads such as utilities, insurance and rents – which have driven additional cost pressures that reflect lagging factors and may ease.
For now, we think the RBA can remain patient, taking the win from goods disinflation but the breadth of strength in services inflation remains a concern.
Important notice
This document has been prepared by National Australia Bank Limited ABN 12 004 044 937 AFSL 230686 (“NAB”). Any advice
contained in this document has been prepared without taking into account your objectives, financial situation or needs.
Before acting on any advice in this document, NAB recommends that you consider whether the advice is appropriate for
your circumstances.
NAB recommends that you obtain and consider the relevant Product Disclosure Statement or other disclosure document,
before making any decision about a product including whether to acquire or to continue to hold it.
Please click here to view our disclaimer and terms of use.