
Overview
- With inflation moderating more than expected in Q2 and
further evidence of activity slowing, we now see only
one more rise in the cash rate, taking the peak to 4.35%
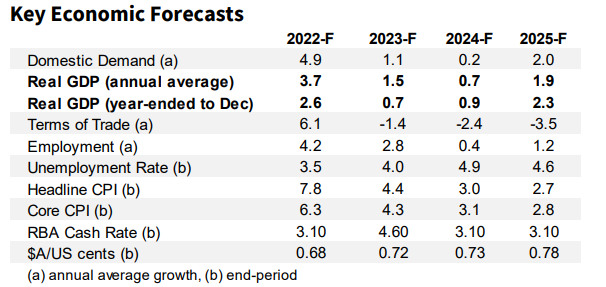
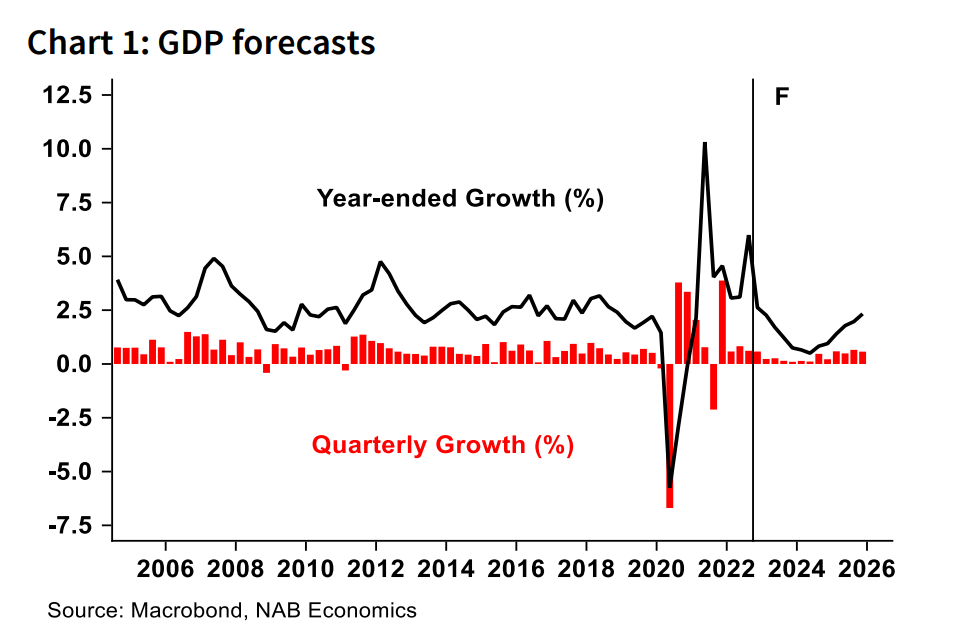
– most likely in November. - Our forecasts for GDP growth have strengthened
marginally, reflecting stronger Q2 exports, but we
nonetheless continue to expect growth to be well below
trend at 0.7% y/y in 2023 and 0.9% y/y in 2024. - High inflation and the ongoing pass through of rate rises
continues to weigh on households. Real consumption
was most likely flat in Q2 and we see small falls in H2
2023. Importantly, consumption growth should improve
in 2024 as inflation moderates and rates begin to
normalise. We see the RBA beginning to cut in August
2024, returning the cash rate to around 3% by early
2025. - The labour market has remained very tight with the
unemployment rate still at 3.5% in June. This should
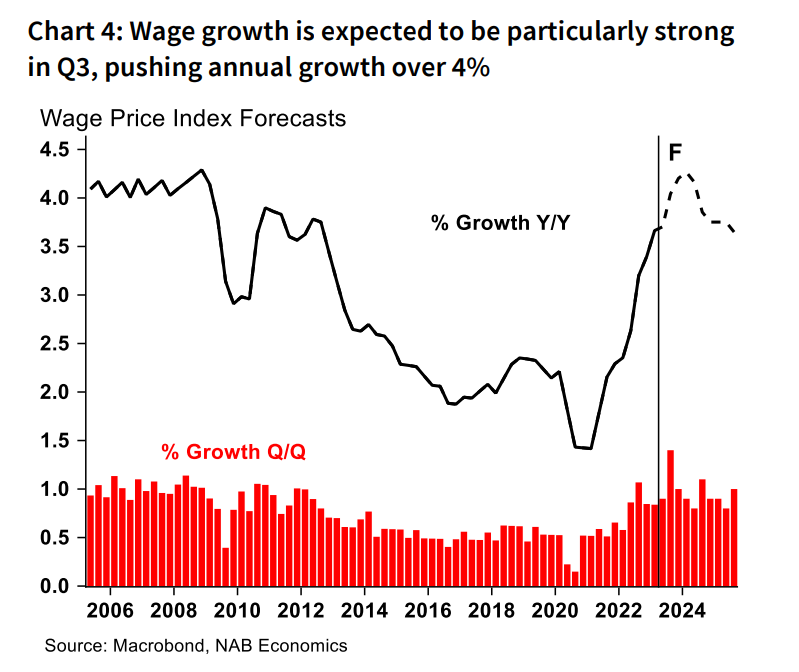
continue to support wage growth in the near term, and
we expect a strong WPI print for Q3 with growth around
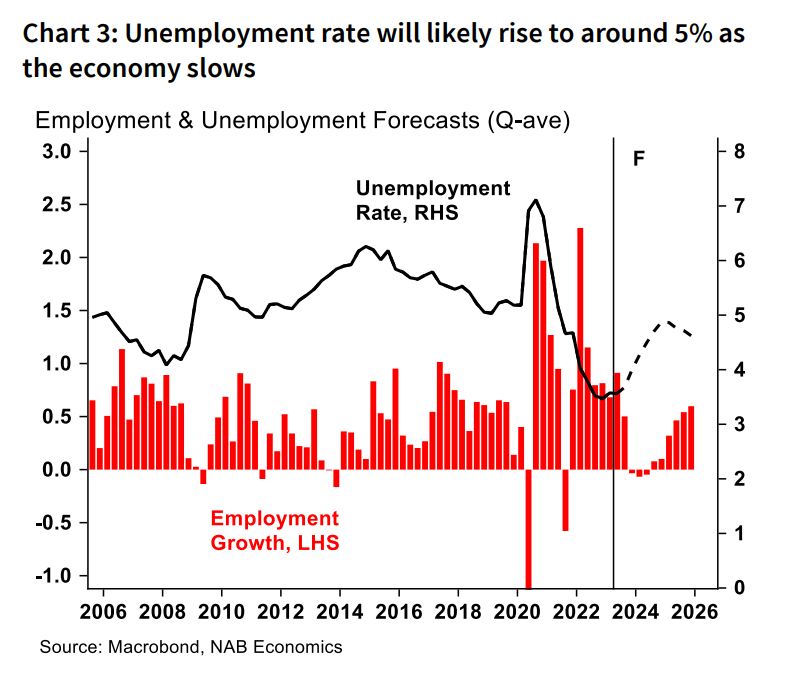
4.2% y/y by end-2023. - As the economy slows, however, softening labour
demand should see the unemployment rate rise back to
4% by end-2023 and around 5% by end-2024. We expect
this easing to be enough to bring wages growth back to
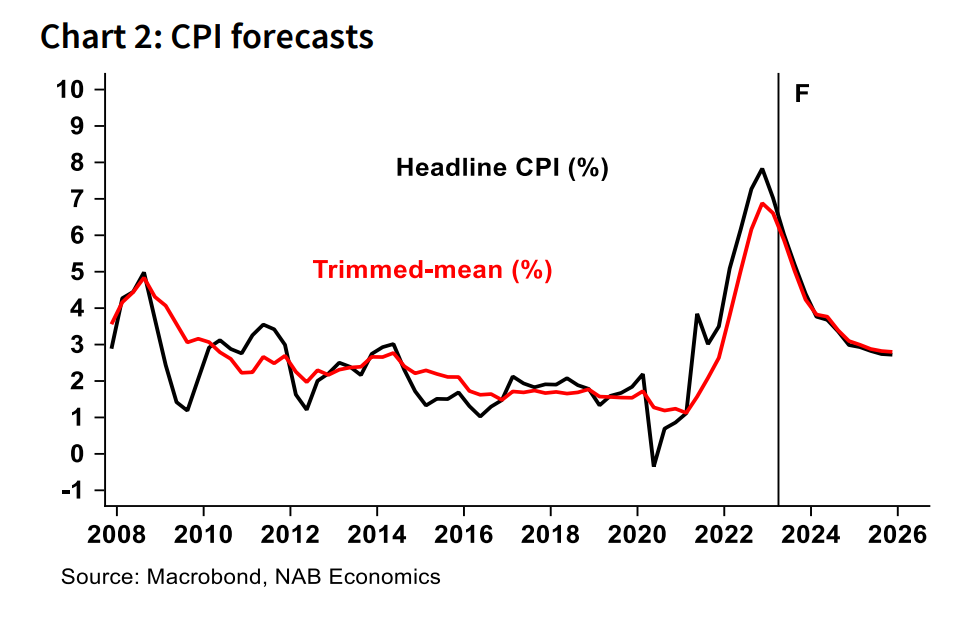
around 3.8% in 2024. - With the economy slowing and global supply chain
issues largely resolved, inflation has started to
moderate, falling to 6% y/y in Q2. We still see significant
pressures on the services side with Q3 CPI likely to show
a re-acceleration before further gradual easing to
around 3% in headline terms by end-2024. The easing in
the labour market and wage growth will play a part in
this but profit margins will also be squeezed as firms
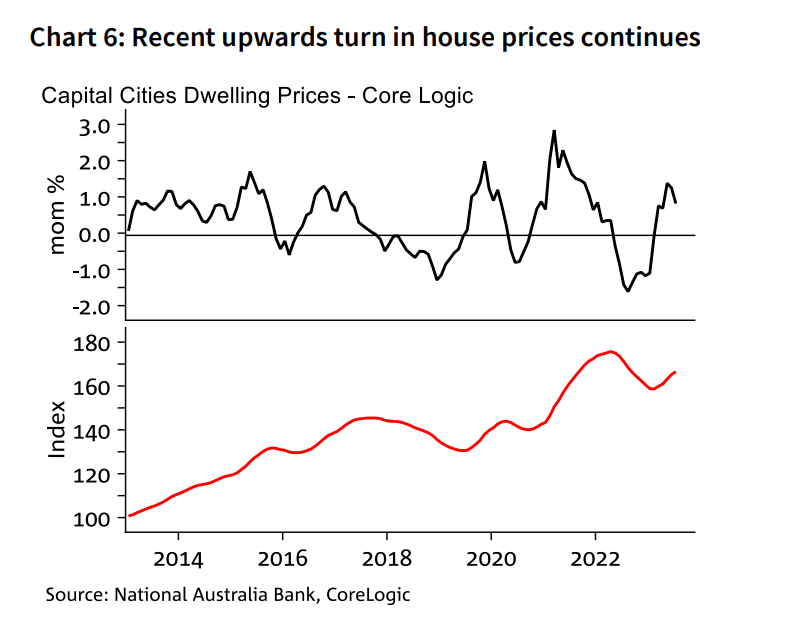
face into an environment of much softer demand. - House prices have continued to rise and have now
regained around half of the fall seen between mid-2022
and early 2023. Rents are also still rising strongly though
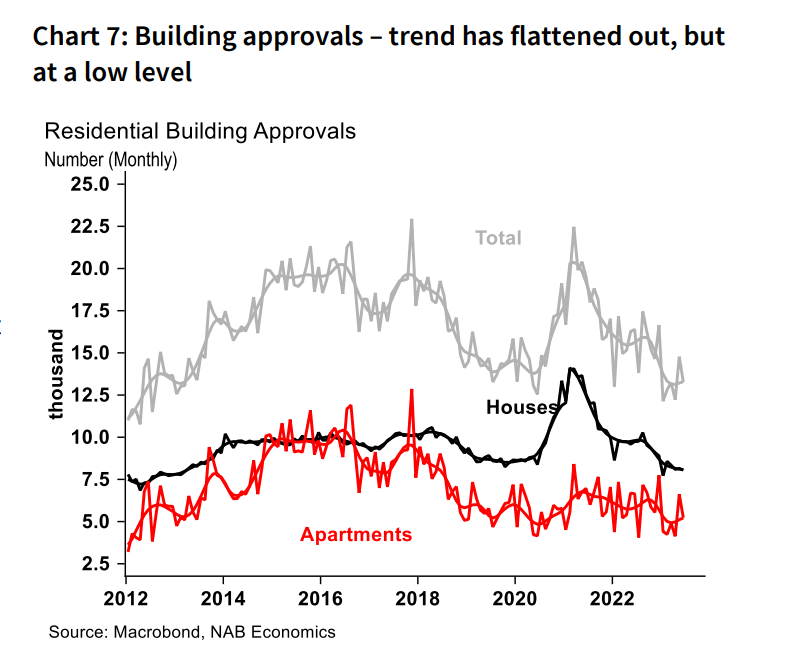
vacancy rates have started to edge back up. Building
activity is still set to ease further although approvals
have started to stabilise after falling early in the year.
Labour Market, Wages & Consumption
Wage growth is set to strengthen in the second half of
2023 as the labour market continues to show few signs
of easing – though we still expect unemployment to
rise eventually as the economy slows.
The unemployment rate was steady in June at 3.5% (with
the May result revised down from 3.6%). Employment rose
33k in the month, continuing a run of strength that has
kept the employment-to-population ratio at a historic
high of 64.5%. There are now more than one million more
people employed than in March 2020.
We continue to see the unemployment rate beginning to
rise later in the year as the economy slows and labour
demand softens, reaching around 4% by end-2023 and 5%
by end-2024.
Wage growth is now a key focus with the Q2 Wage Price
Index (WPI) out today likely to show growth remaining
around 3.7% y/y. Further ahead, we expect a strong rise in
Q3 as minimum and award wage increases take effect and
other wage adjustments occur in the context of a very
tight labour market. There is also some evidence that the
share of wages adjusting in July is rising, contributing to a
larger than usual seasonal effect.
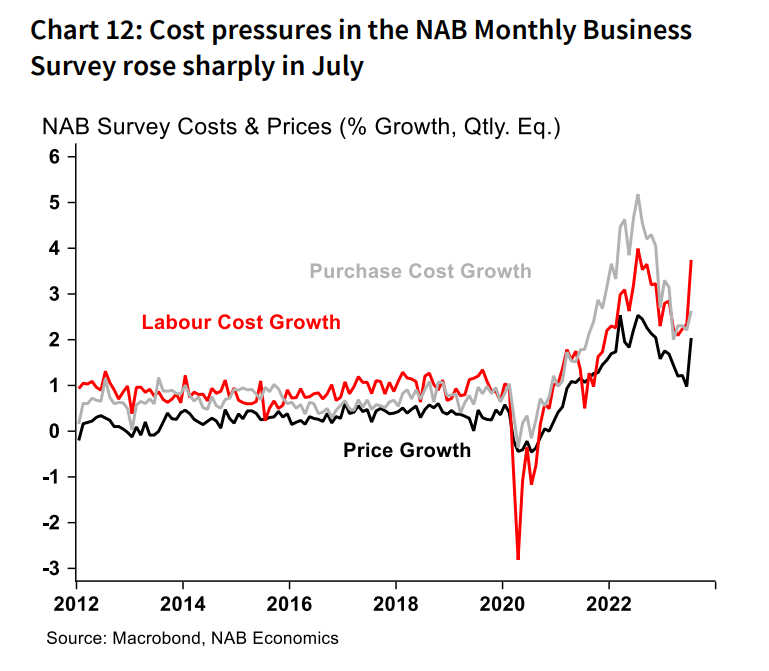
Labour cost growth in the NAB Business Survey rose
sharply in July, from 23% to 3.7% in quarterly terms, likely
reflecting a combination of these factors (though labour
cost growth also captures employment growth). In terms
of hourly wage growth (as measured by the WPI), we
expect to see growth of around 4.2% y/y for 2023 as a
whole, easing slightly to around 3.8% y/y for 2024.
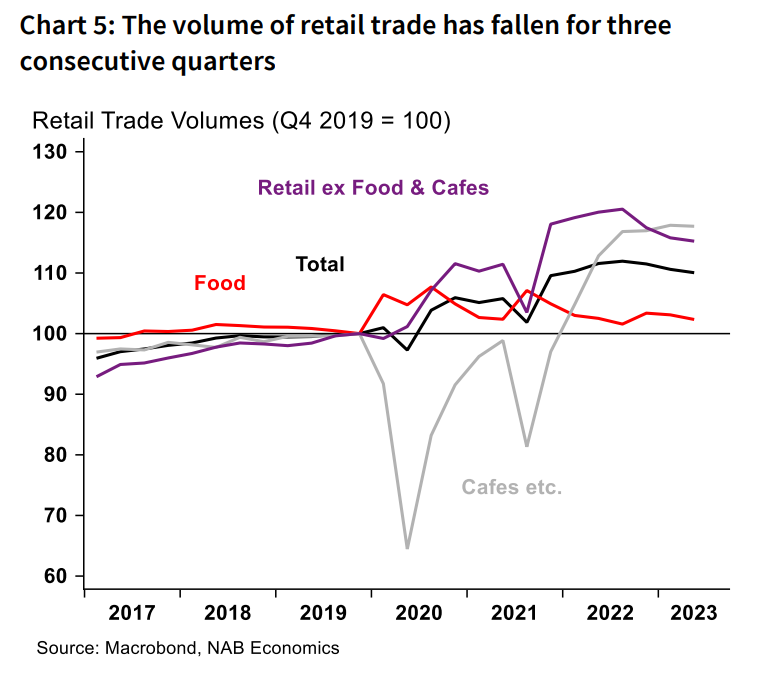
Real retail turnover fell in Q2, foreshadowing a soft
quarter of consumption growth with further weakness
likely to follow.
Retail trade declined by 0.5% in volume terms in Q2,
marking the third consecutive quarterly decline. Falls in
retail volumes have been rare outside of major downturns,
but the decline since late 2022 partly reflects the ongoing
rebalancing from elevated goods consumption towards
services consumption.
Nonetheless, there was a small 0.1% decline in cafes &
restaurants in Q2, the first fall in this component since
lockdowns ended and a possible sign the recovery in
services consumption has run its course. Components
such as health and rents should still rise, but we expect a
flat quarter for consumption growth overall.
Going forward, we expect the effects of inflation and
interest rates to dominate over coming quarters, seeing
real consumption declining slightly despite underlying
population growth. Consumption should begin to recover
from the second half of 2024 as rates begin to normalise
and real wage growth recovers.
Housing and Construction
House prices and rents continued to grow solidly in
July although the pace may have moderated. Housing
finance and (tentatively) building approvals have
stabilised of late and there are signs that construction
supply constraints are abating.
House prices again increased in July but at a slower pace
than prior months. The Core Logic Capital City Home Value
Index increased 0.8% m/m – down from 1.4% in May –
while the PropTrack measure rose only 0.2% (with its
recent high of 0.8% also being in May). Over the last five
months capital city prices rose 5.0% (Core Logic),
reversing about half the fall seen between mid-2022 and
early 2023. Dwelling prices grew by 1% m/m or more in
July in Brisbane, Adelaide and Perth and with no clear
softening from prior months, while they fell in Canberra
and were flat in Hobart.
Capital city rents also grew by 0.8% m/m in July (Core
Logic hedonic measure). The growth rate has eased from a
few months ago, but it is too early to identify any clear
downwards trend as the series has been somewhat
volatile. That said, vacancy rates have started to edge
back up although they remain at a very low level.
Housing finance approvals fell slightly in June (-1.0%
m/m) and are 18% lower than a year ago. That said, they
broadly appear to have stabilised (up over 7% over the last
four months). The number of loans to owner-occupiers for
new home construction increased in June (up 6%), but
remains very low by past standards. Similarly, in trend
terms, dwelling approvals have levelled off for now (the
7.7% fall in June followed a larger rise in May) although
this improvement is driven by the volatile other (nonhouse) dwelling category so it is a tentative conclusion.
We still expect to see further falls in residential investment
even as we near the peak for interest rates in this cycle.
Residential investment has fallen in six of the last seven
quarters (to Q1 2023) and is forecast to continue falling
through the rest of this year and into 2024. It should be a
relatively gradual decline as there is still a large pipeline of
work.
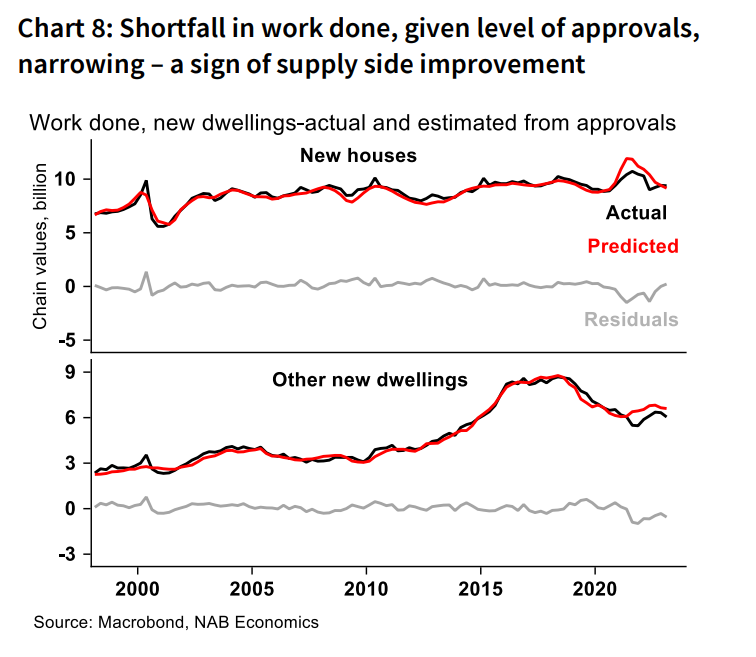
Supply disruptions and labour shortages meant that in
recent years work done has been well below what would
be expected given approvals. There are signs that this is
now turning around. Construction sector respondents to
NAB’s Quarterly business survey suggest labour
constraints have become less significant (even though
they remain an issue) while material constraints have also
eased. Housing cost construction inflation is now running
at 1% q/q or below depending on the measure used – well
down on the 4-6% q/q pace seen in 2022. This still leaves
the level of housing costs well above their pre-COVID level
(over 30%) which, together with the lift in interest rates,
will be an impediment to investment for a time to come.
Business and Trade
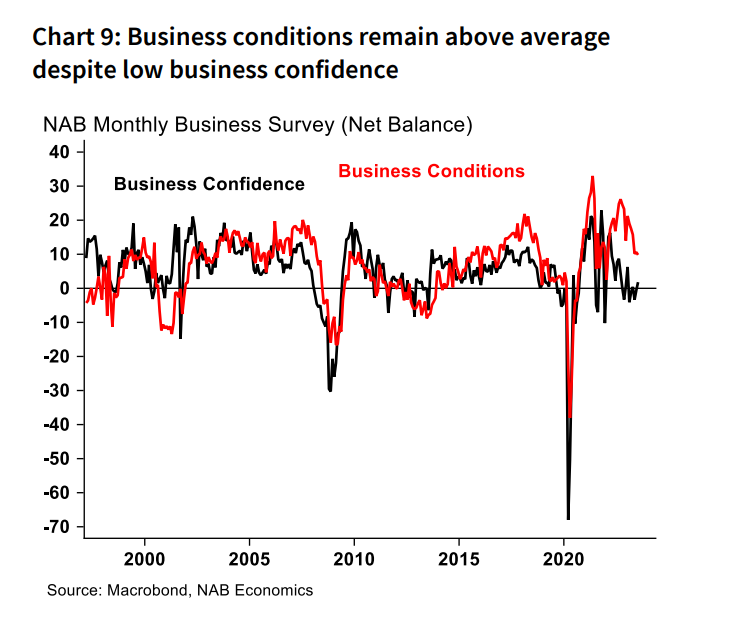
Business conditions have remained resilient despite
weakness in forward indicators, and capacity
utilisation remains elevated.
Business conditions in the NAB Monthly Business Survey
were broadly steady at +10 index points in July with the
trading, profit and employment sub-components all
steady. Retail conditions strengthened, reversing a fall in
June, and remain above average despite the weakness in
recent retail trade data. Overall capacity utilisation also
rose in July, back to 84.6% to remain well above average.
The resilience of the survey’s conditions measures
continues to contrast with soft leading indicators with
business confidence still low (+2 index points) and forward
orders still negative (-1 index point).
Higher rates and low confidence levels continue to cloud
the outlook for investment. Total business credit growth
slowed further in June, to 0.3% m/m (from 0.5% in May).
We continue to see softer growth in business investment
over the period ahead as a result.
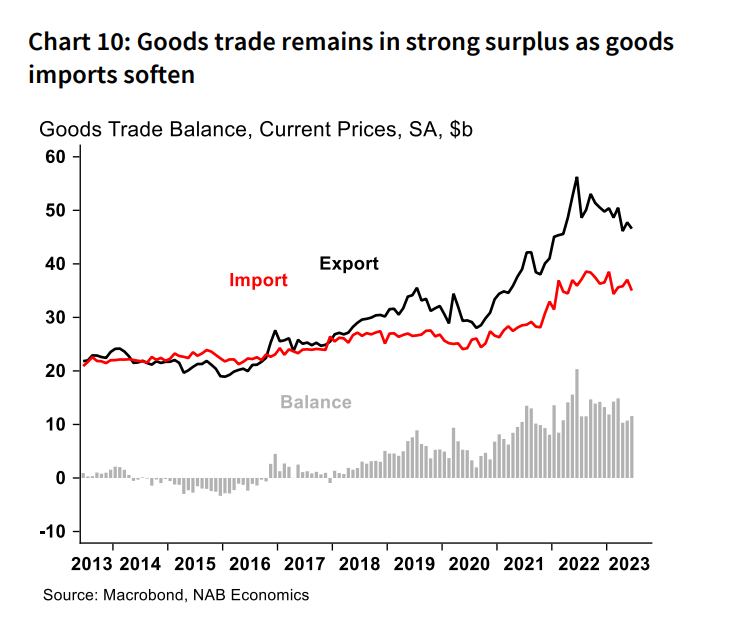
The nominal trade surplus rose to $11.3b in June (from
a revised-down $10.5b in May). Net exports likely made
another strong contribution to real GDP growth in Q2,
and should continue to support growth as weak
consumption weighs on imports.
Exports declined 1.7% in the month, largely driven by coal
and oil and gas as prices fell. However, the decline in
exports was more than offset by a 3.9% fall in imports,
driven by a large fall in consumption goods (down 12.4%).
This was largely the result of a sharp fall in non-industry
transport equipment imports which have been volatile as
backlogs have cleared and the 30 June end of the instant
asset write-off scheme has approached.
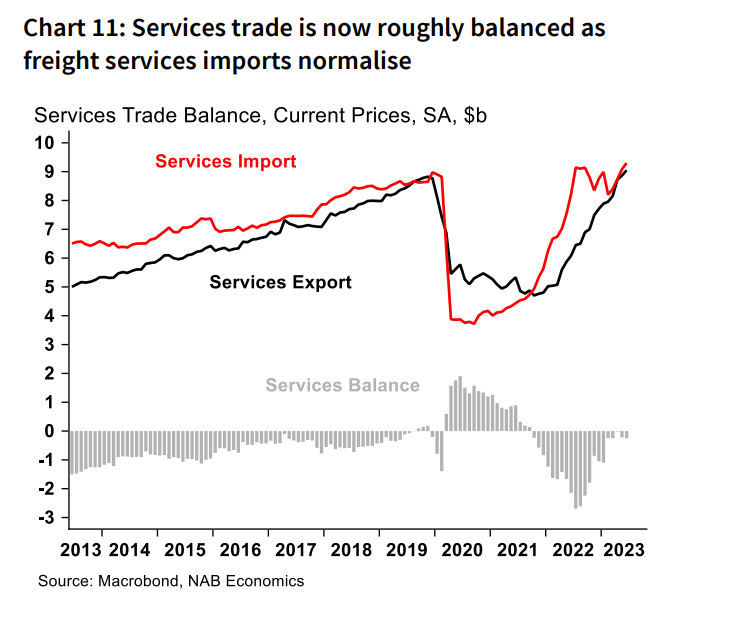
For services, there was a further pickup in both exports
and imports in the month with services trade now roughly
balanced. Freight services – which surged during the
supply chain crisis – have continued to normalise, now
down to 4.1% of the total value of goods imports.
For Q2 as a whole, nominal exports declined but this was
more than explained by price movements with large falls
across key commodities. As such, the underlying volume
of exports likely increased by around 4%, while import
volumes are expected to have been broadly flat. As a
result, net exports likely contributed 0.5-0.7ppts to GDP
growth in the quarter.
Further ahead, we continue to expect weak demand to
weigh on imports more broadly over coming quarters,
while the continued normalisation of global trade should
support export volumes.
Monetary Policy, Inflation and FX
The Q2 CPI showed some further progress on inflation
but significant pressures remain – particularly in Q3.
Headline CPI in Q2 rose 0.8% q/q (6% y/y) and the
trimmed mean grew at 0.9% q/q (5.9% y/y), marking
significant progress from the very elevated rates seen in
2022. In the detail, there was improvement across both
goods (0.9% q/q, down from 1.2% in Q1) and services
(0.8% from 1.7%). However, market sector measures,
which better reflects general supply and demand
pressures, accelerated slightly.
Food price growth remained elevated at 7.5% y/y and
while new dwelling prices are moderating (7.8% y/y from a
peak of over 20% in 2022) rent inflation reached 6.7% y/y
to be the highest since 2009. There was also a large rise in
insurance prices in the quarter.
Further improvement in goods prices is expected but
progress on services inflation is likely to be slower with
pressure coming from higher wage growth, energy prices,
and the ongoing pass through of elevated market rents.
These challenges were evident in the NAB Monthly
Business Survey in July. As noted above, labour cost
growth jumped from 2.3% to 3.7% in quarterly terms, and
purchase cost growth also rose from 2.2% to 2.6%.
Businesses appeared to pass some of these pressures
directly to consumers with product price growth up from
1% to 2%. Price growth in the retail sector rose to 2.6%,
while in recreation and personal services it was 2.9%.
On balance we see a strong Q3 inflation print as likely
before inflation gradually moderates to around 4.5% by
end-2023 and 3% by end-2024.
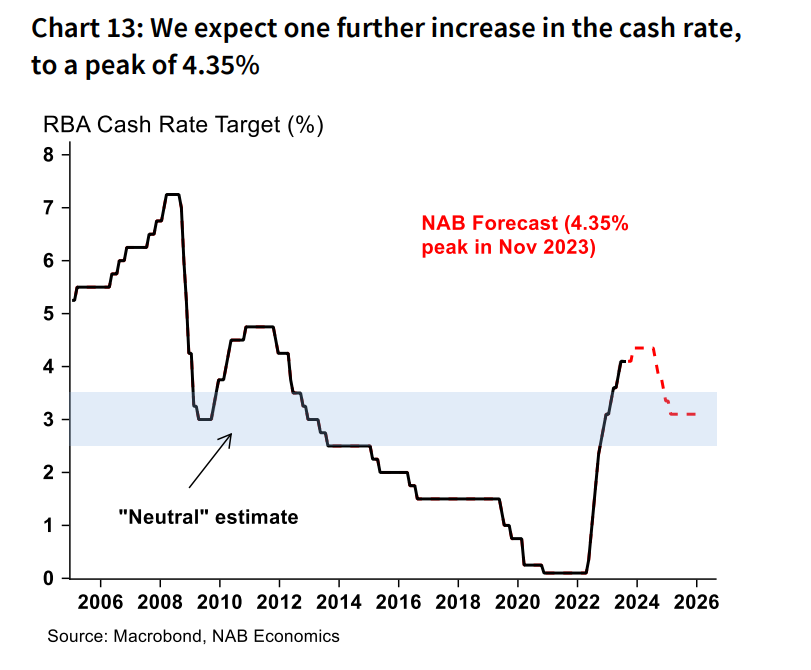
With inflation moderating, the RBA kept rates on hold
again in August, and we now see scope for only one
further rise to a peak of 4.35% (previously 4.6%).
The Board viewed the risks around inflation as “broadly
balanced” and appear willing to wait to be pushed to raise
rates further. The longer they wait, the more we expect the
economy to slow, limiting the need for further increases.
However, we expect the strength of inflation through Q3
will push the Board to take out additional insurance
against inflation remaining above target. In fact, the
updated RBA staff forecasts published post-meeting
showed the crucial mid-2025 inflation forecast has crept
higher, to 3.2% – with an assumed rate path including one
further rise.
We see a rise in the cash rate to 4.35% in November as
most likely, after the release of the full Q3 CPI, and rates
should remain at that level until the second half of 2024.
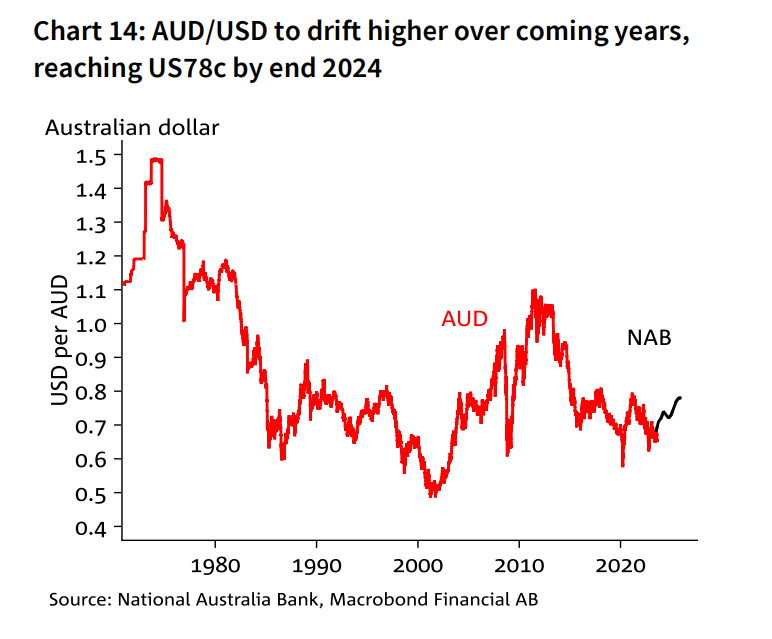
The AUD has weakened since mid-July, back to the low
US65c range after almost reaching US69c.
Rising US yields and weak China growth are weighing but
we still see the AUD returning to US72c by December.
Theme of the Month: Household Disposable Income
With interest rates rising more than 400bps in a year
and signs that consumption is slowing, household
disposable income is a critical factor shaping the
outlook. However, the forces acting on household
incomes are varied.
In aggregate, interest payments by households have
increased sharply to be around $12b per quarter higher in
Q1 2023 (relative to Q1 2021), but interest income has also
increased, with the net interest cost to the household
sector per quarter increasing only around $4b. Both
interest payable and income likely rose further in Q2.
The distribution of interest income and payments is likely
to be highly uneven across households, and not all
interest income is available to support cashflow (for
example, earnings within superannuation accounts).
Nonetheless, the two-sided impact of higher rates is an
important feature shaping disposable income.
Importantly, the shifts in interest rates are relatively small
when compared to the shifts in wage income and taxes.
The strength of the labour market has meant that wages
income has grown rapidly, to be around $53b per quarter
higher than pre-COVID. There has also been a
corresponding rise in income taxes paid, which are around
$19b higher per quarter, while transfer payments have
normalised as pandemic payments have ended.
All of these effects have been swamped by the impact of
inflation. Adjusting disposable income for change prices
(using the consumption deflator), real disposable income
grew during the pandemic period as government support
flowed to households, but has declined steadily since Q3
2021 as prices have rapidly increased. In per capita terms,
this represents an even more dramatic correction,
underlining the significant pressures facing households.
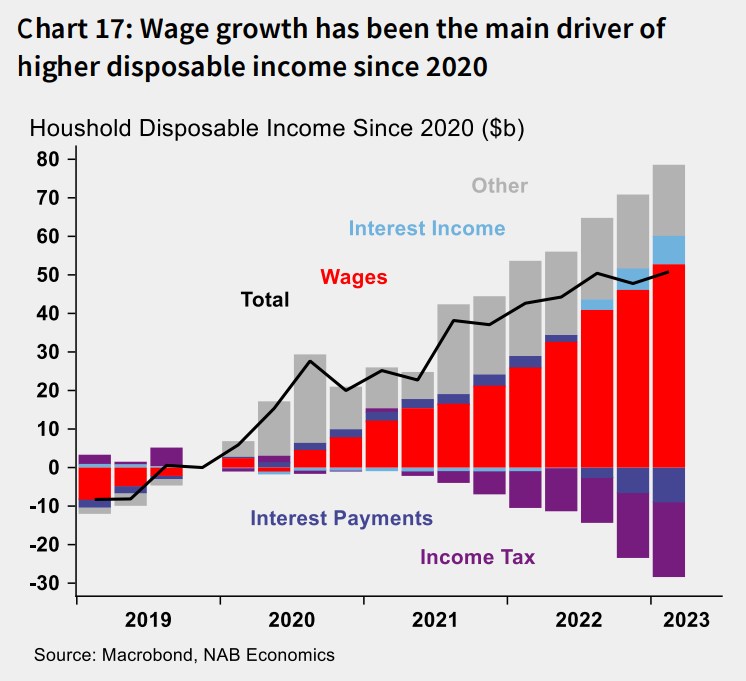
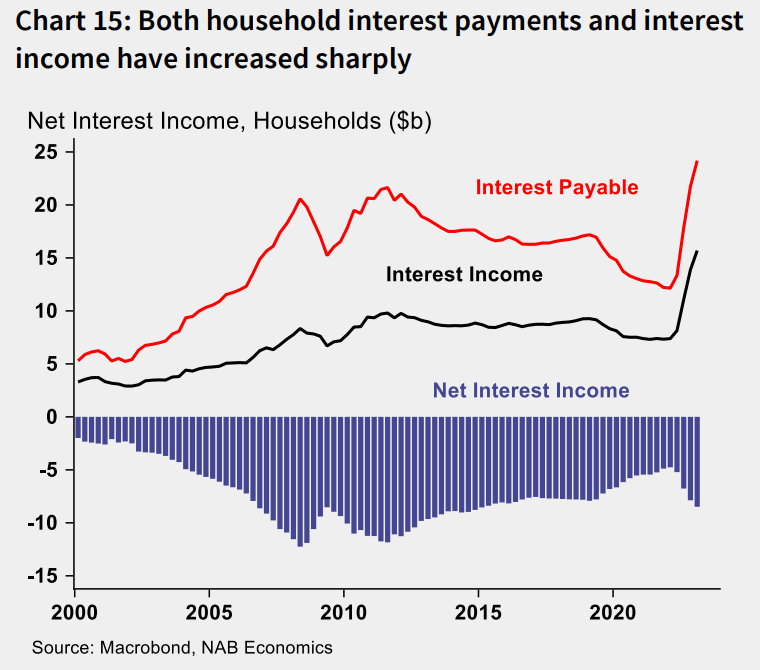
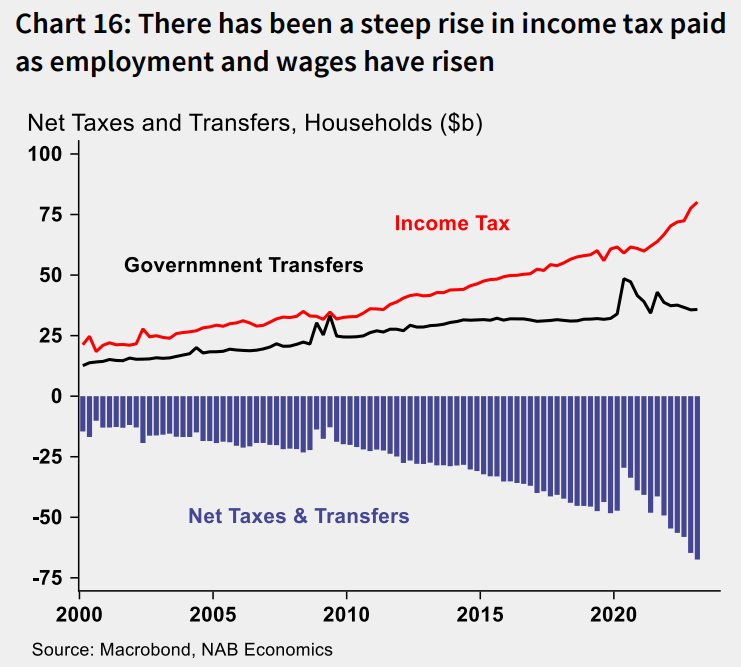
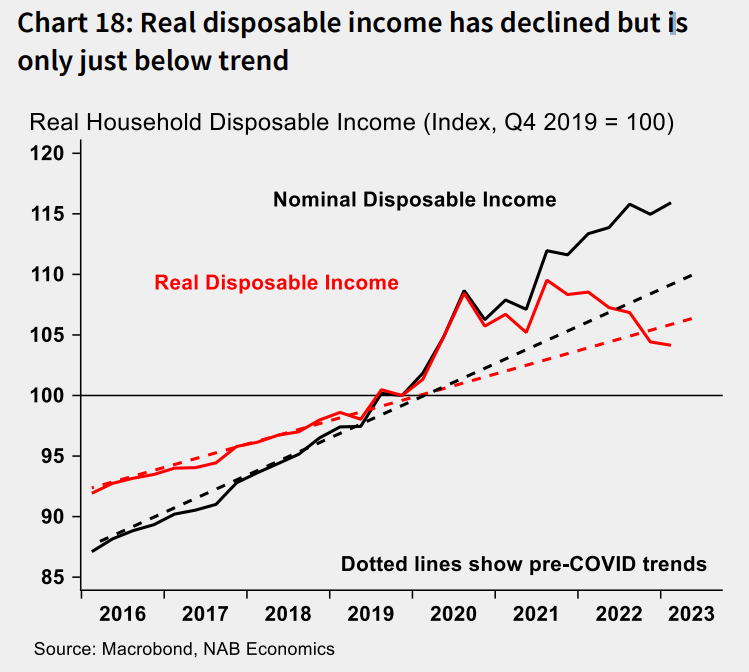
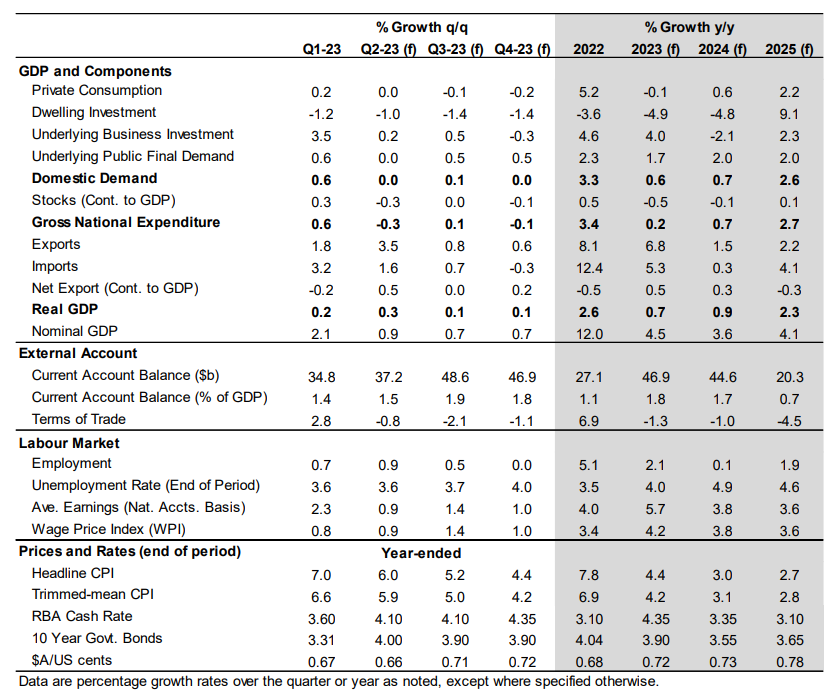
Table of Economic Forecasts
Group Economics
Alan Oster
Group Chief Economist
+(61 0) 414 444 652
Jacqui Brand
Executive Assistant
+(61 0) 477 716 540
Dean Pearson
Head of Behavioural &
Industry Economics
+(61 0) 457 517 342
Australian Economics
and Commodities
Gareth Spence
Senior Economist
+(61 0) 422 081 046
Brody Viney
Senior Economist
+(61 0) 452 673 400
Behavioural &
Industry Economics
Robert De Iure
Senior Economist –
Behavioural & Industry
Economics
+(61 0) 477 723 769
Brien McDonald
Senior Economist –
Behavioural & Industry
Economics
+(61 0) 455 052 520
International
Economics
Tony Kelly
Senior Economist
+(61 0) 477 746 237
Gerard Burg
Senior Economist –
International
+(61 0) 477 723 768
Global Markets
Research
Ivan Colhoun
Chief Economist
Corporate & Institutional
Banking
+(61 2) 9293 7168
Skye Masters
Head of Markets Strategy
Markets, Corporate &
Institutional Banking
+(61 2) 9295 1196
Important notice
This document has been prepared by National Australia Bank Limited ABN 12 004 044 937 AFSL 230686 (“NAB”). Any advice
contained in this document has been prepared without taking into account your objectives, financial situation or needs.
Before acting on any advice in this document, NAB recommends that you consider whether the advice is appropriate for
your circumstances.
NAB recommends that you obtain and consider the relevant Product Disclosure Statement or other disclosure document,
before making any decision about a product including whether to acquire or to continue to hold it.
Please click here to view our disclaimer and terms of use.