
Overview
Our forecasts are unchanged this month with official
data, the NAB business survey and our internal
transactions data all pointing to ongoing resilience in
aggregate.
• That said, with the ongoing pass through of higher rates
and inflation still high we see consumption growth
remaining soft in H2 2023 and expect below trend GDP
growth of 1-1.5% in 2023 and 2024.
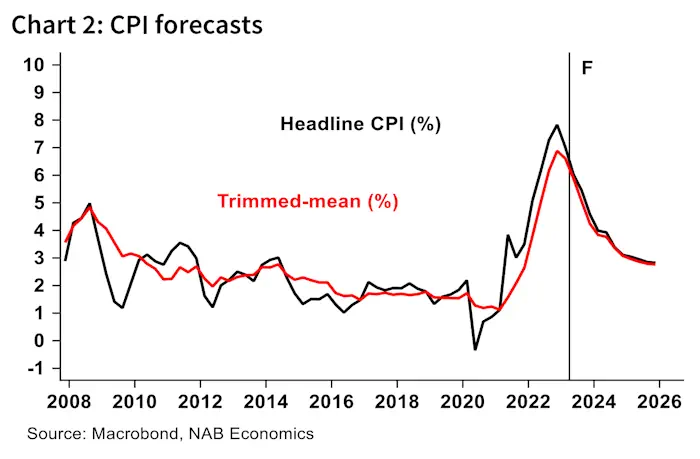
• We continue to expect the unemployment rate to rise to
around 4.9% through 2024 with slower labour demand
growth unable to absorb the full impact of high
population growth. However, forward-looking
indicators of the labour market remain healthy. More
broadly, despite the slowing in growth to date, the
labour market has remained resilient.
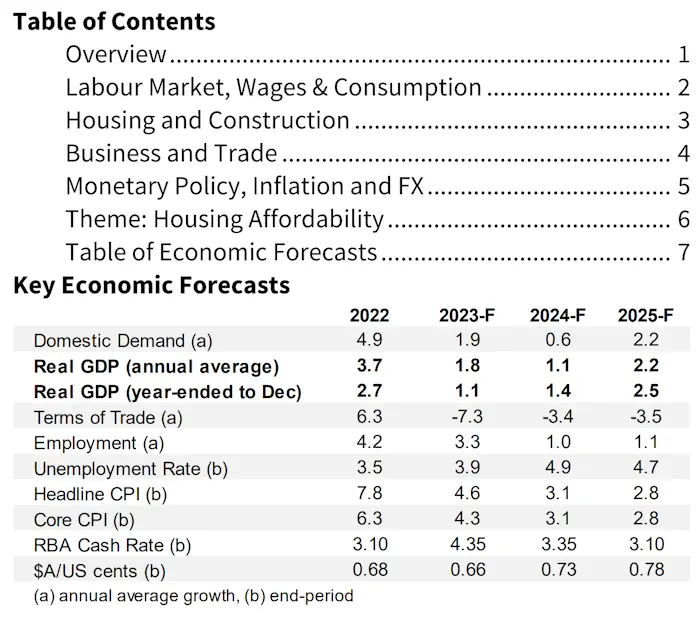
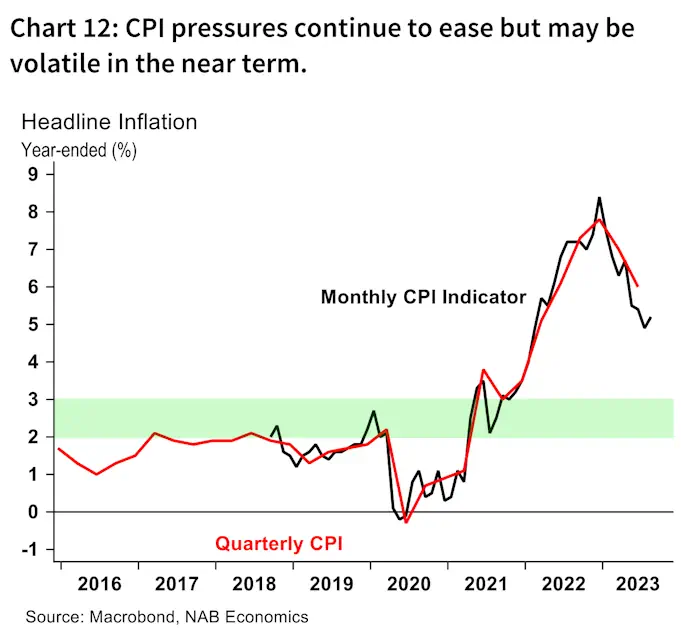
• The Q3 CPI released next week will provide a key marker
of the ongoing moderation in inflation. In quarterly
terms, we see a 1.1% increase in the quarter for both the
headline and trimmed mean measures. While this would
mark a small reversal in the trend easing in quarterly
terms, year-ended inflation will continue to moderate.
• For monetary policy the pace of this ongoing
moderation in inflation remains crucial. The
improvement in the year-ended rate will be driven
partly by base effects as large outturns in Q3 and Q4 of
2022 fade. The moderation from 4% to 3% will be more
difficult. Domestic factors will continue to grow in
importance as global factors continue to fade (although
the war in the Middle East highlights that geopolitical
and other risks can materialise rapidly).
• For now, domestically wage growth has not accelerated
to a pace inconsistent with inflation returning to target
and expectations in the medium- and long-term remain
anchored.
• The depreciation in the exchange rate over recent
months presents some upside risk though typically
exchange rate passthrough is gradual and global price
inflation is easing. How firms pricing decisions respond
to slower consumer demand will also be important
• In terms of housing, prices continue to rise and, as
explored in this month’s theme, this has continued to
challenge affordability.
Labour Market, Wages & Consumption
The labour market remains tight with unemployment
at 3.7% and job vacancies remaining elevated despite
falling in Q3. Still, we continue to expect
unemployment to start to rise as the economy slows.
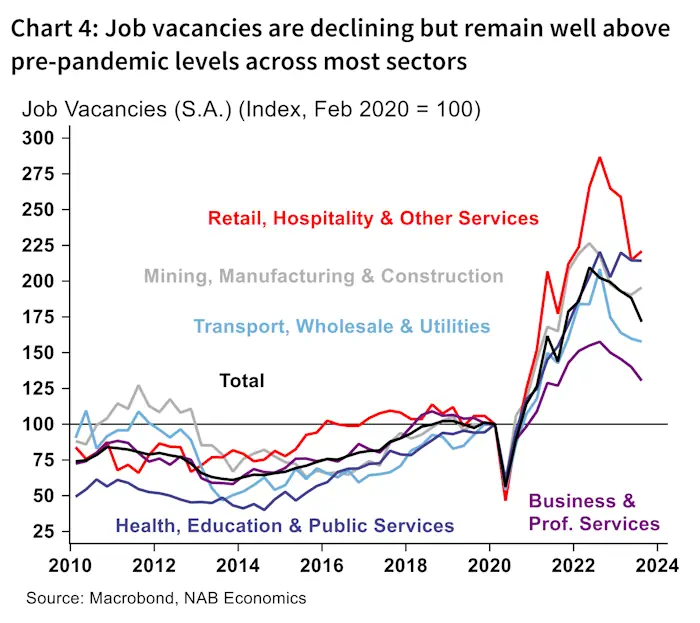
Data on job vacancies for August (Q3) showed an 8.9%
decline since May. Vacancies are now down around 18%
from their peak in early 2022 but at 390k, the number of
vacancies remains very elevated relative to pre-pandemic
levels. Vacancies have fallen most in frontline services
sectors like retail and hospitality, but these remain the
most elevated, alongside public services like health and
education.
Employment growth has remained strong as vacancies
have declined, keeping unemployment at low levels even
as the population has grown rapidly. As the economy
slows, however, employment growth should also slow and
some vacancies may be ‘extinguished’ rather than filled.
As a result, we see the unemployment rate rising to
around 4% by end-2023 and approaching 5% by end-2024.
On wages, we continue to expect to see a material pickup
in hourly wage growth in Q3 when the Wage Price Index
(WPI) is released in November. This should see year-ended
wage growth surpass 4% by the end of 2023, before the
softening labour market begins to ease wage pressures
later in 2024.
Retail trade growth was soft in August though price
movements may have played a role in the result. The
level of spending is high but households’ discretionary
spending is under pressure.
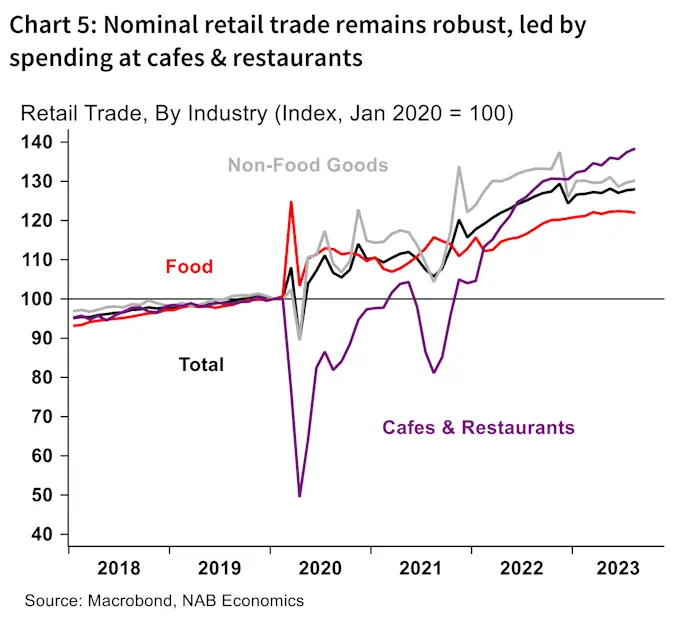
Nominal retail trade data from the ABS showed sales rose
0.2% in August, softening from a more solid 0.5% in July.
Spending on food fell 0.3% in August (though falls in fruit
and vegetable prices may have contributed) and
household goods spending fell 0.4%. On the other hand,
spending on clothing, department stores and other
retailing all rose in the month, as did cafes & restaurants
(up 0.7%).
More recently, transaction data analysis in NAB’s Monthly
Data Insights suggested retail spending grew 0.4% in
September. More broadly, the transaction data suggests
overall consumer spending grew around 3% in nominal
terms for Q3 as a whole. Fuel price increases contributed
to spending growth in August and September, but overall
spending still rose with fuel excluded.
This suggests consumption growth likely remained
positive in real terms for the quarter, although the result is
still expected to be subdued in a continuation of the slow
consumption growth seen in Q2. Population growth
remains a key factor supporting consumption with percapita consumption expected to continue declining for the
time being as households continue to adjust to higher
interest rates.
Housing and Construction
Despite the rapid rise in interest rates over the past
year house prices continue to rise at a brisk pace and
the very low rental vacancy rate continues to support
strong rents growth.
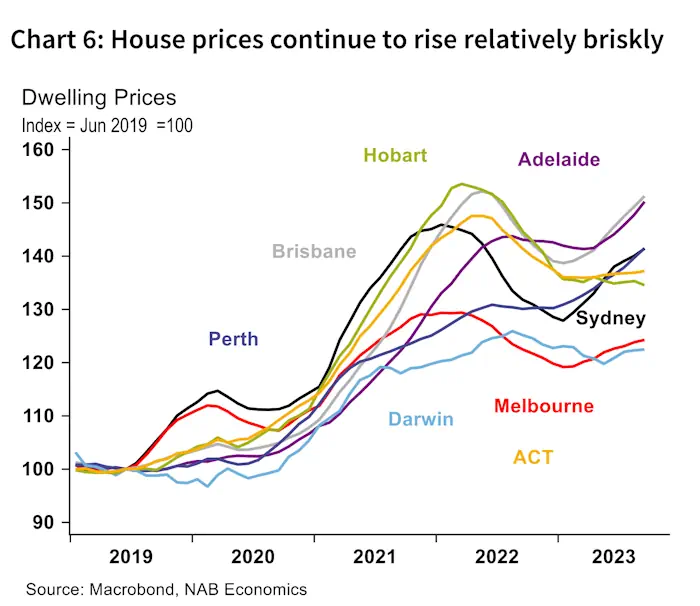
The CoreLogic 8-capital city dwelling price index rose by
0.9% in September while the combined regional index
continues to track at a lower rate, rising by 0.4% m/m.
Overall, capital city house prices rose 2.5% over the past 3
months and are now up 5.1% over the past year.
Price growth in Sydney has slowed over recent months,
but remains robust at 1% m/m. However, the smaller
capitals have accelerated with Adelaide leading the rise at
1.7% m/m, followed by Brisbane and Perth at 1.3%.
Melbourne continues to track at a slower pace rising 0.4%
in the month and 1.3% over the past quarter.
With the trend in house prices unlikely to change
significantly over the next 3 months, prices are likely to
end the year 8-10% higher and we continue to see gains of
around 5% over 2024 (with rate cuts in H2 to provide some
support). The ongoing increase in prices, from a high level,
amidst the sharp increase in interest rates has led to a very
sharp deterioration in housing affordability over the past
year (discussed on Page 6). While higher house prices
provide some support via the “wealth effect,” the cost-ofliving impact of more expensive housing could be a factor
weighing on consumer spending.
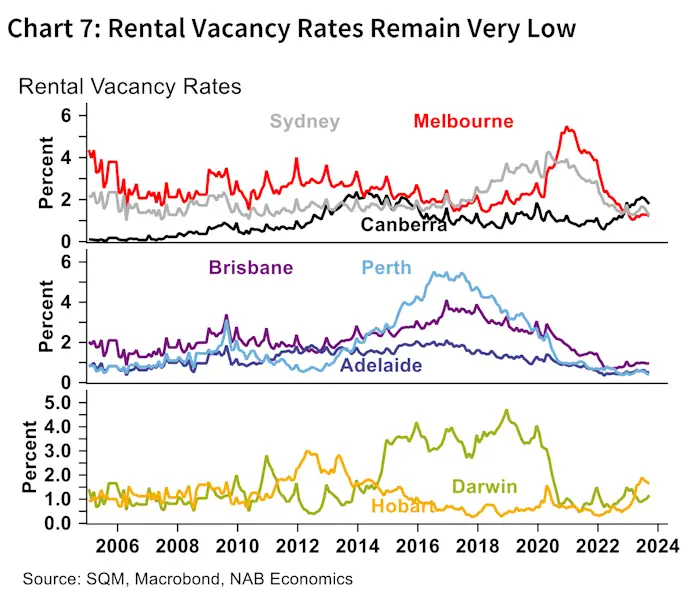
Indeed, the picture in the rental market points to similar
stress. Rents growth has slowed in annual terms over
recent months but has shown some mixed trends across
the capitals on a monthly basis. Growth in Perth rents is
now strongest at 13% y/y followed by Melbourne at 12%
and Sydney at 11%. Brisbane and Adelaide have tracked at
a slightly slower, though still very strong pace of 7% and
8%, respectively, over the past year. While there had been
some tentative sign of an easing in rental vacancy rates for
Sydney and Melbourne over recent months, they again
declined in September and remain very low across the
remaining capitals.
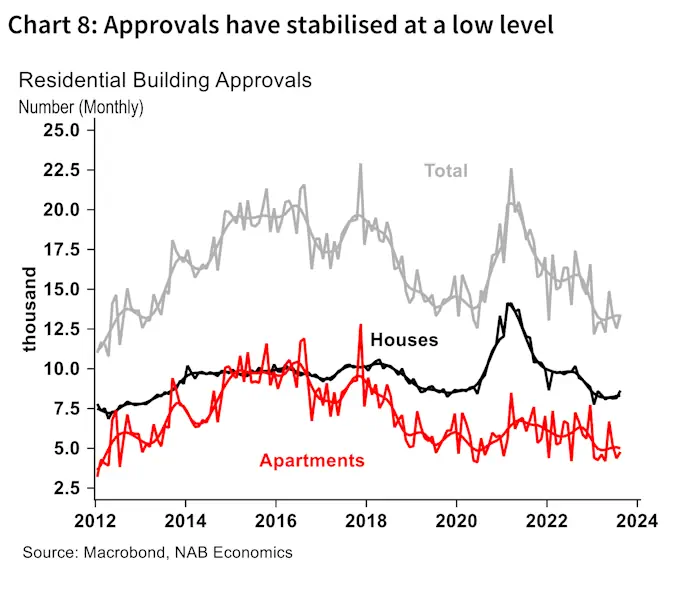
Amidst strong demand, the supply side remains
challenged. While, building approvals rose 7% in August
(with both houses, up 6.8%) and higher-density (up 9.4%)
rising in the month), total building approvals remain 23%
lower over the past year and appear to have stabilised at a
decade low rate of around 13.5k monthly.
Our Residential Property Survey for Q3 (released later this
week) continues to suggest that rising rates and
construction costs remain large barriers to new
construction despite a slight easing in the quarter.
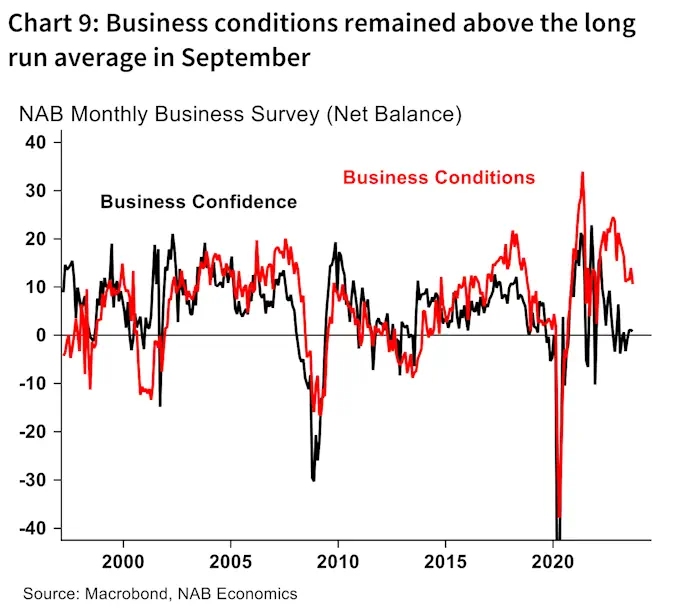
Business and Trade
Business conditions eased in September but remained
above the long run average, while cost growth
measures also stepped down.
Conditions in the NAB Business Survey were down slightly
in September but remain above average at +11 index
points, where the index has hovered since May.
Importantly, capacity utilisation remains high and there
has been gradual improvement in forward orders.
Confidence was steady and while still sitting well below
average, has been around zero in net balance terms for
several months.
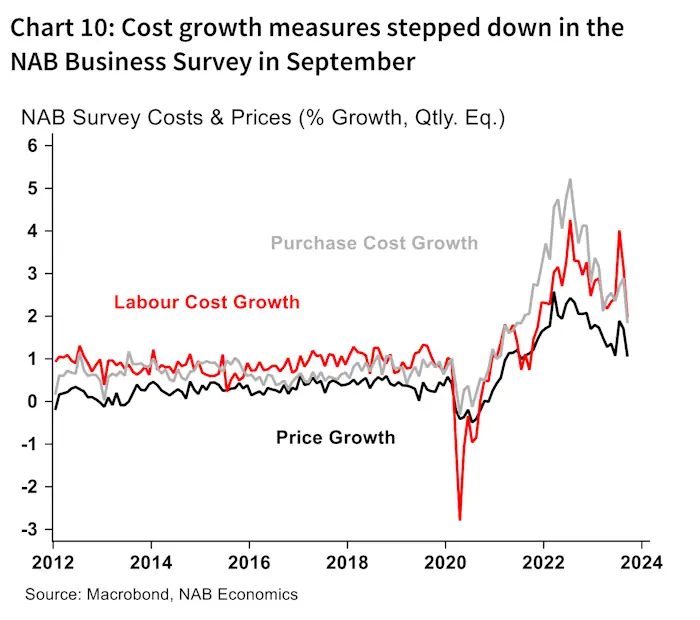
The survey also showed some positive signs for inflation
with cost pressures and price growth easing. Labour cost
growth – which spiked to 4.0% in quarterly terms in July –
fell to 2.0% in September, and purchase cost growth also
eased materially, though both remain elevated. Output
price growth eased, driven by an easing in rec & personal
(0.8%), while retail price growth remained elevated (1.8%).
Business credit growth picked back up in August, rising
0.6% m/m after a softer 0.2% rise in July. In year-ended
terms, business credit is up 7.4%, continuing a gradual
moderation. Below-trend economic growth should
continue to weigh on business credit and investment but
so far investment has shown resilience in line with the
broader economy and pressures generated by a very tight
labour market.
The trade balance rose in August, driven by a rise in
non-monetary gold exports. Trade remains a key
source of volatility for the forecasts.
The trade surplus rose by $2.3 billion in the month, to
$9.6 billion. Exports rose 4%, almost entirely driven by a
$2 billion increase in the volatile non-monetary gold
component. Rural and coal export values fell, offset by a
gain in iron ore. Imports were little changed with fuel and
travel services imports up but aircraft and industrial
transport equipment down.
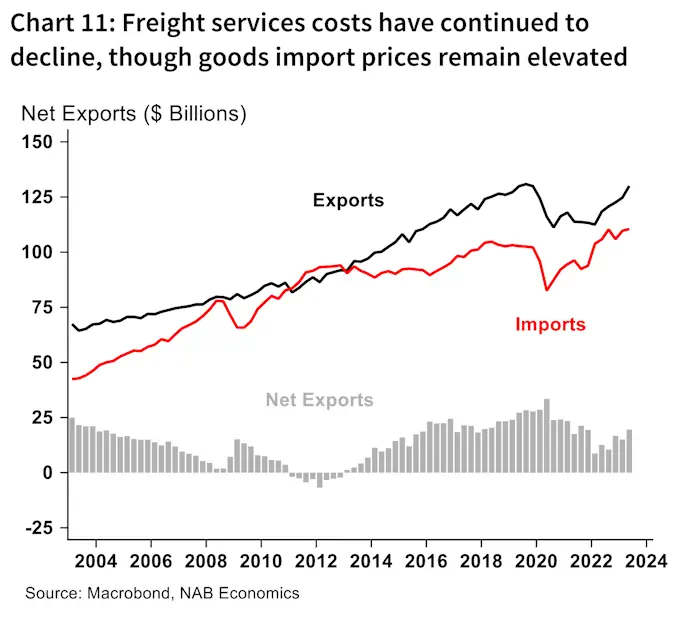
Freight services costs continued to moderate, falling to
3.8% of good imports from a peak of 6.6% in August 2022.
This is an important disinflationary force for goods prices
that is expected to continue flowing through to consumers
over the months ahead. More broadly, Q2 balance of
payments data showed goods import prices have
continued to gradually decline albeit the level of prices
remains very elevated.
Looking ahead, trade volumes remain a key source of
volatility for the forecasts. On the imports side, supply
chains continue to improve but demand is also softening,
while on the exports side the outlook for China remains
uncertain, and the recovery in services trade is also
ongoing. At the same time, recent quarters have seen
significant movements in inventories alongside trade. On
balance we see a fairly stable profile for net exports.
Monetary Policy, Inflation and FX
We expect the Q3 CPI to show a quarterly print of 1.1%
for both headline and underlying inflation, seeing the
year-ended rates fall to 5.2% and 5.0% respectively.
The key drivers of the headline are a large rise in fuel
prices which were up sharply in the quarter, offset by
declines in fruit & veg and childcare. Of some concern is
our expectation for services inflation (ex telco and travel)
to continue to strengthen in annual terms. Rents growth,
in particular, is expected to remain strong.
The moderation in inflation from its peak has been
reasonably sharp, helped significantly by global goods
disinflation. While there is always some variation across
CPI components, at around 1.0% q/q it appears as if most
of the easy gains have been eroded – i.e. inflation will
likely moderate quickly to around 4% but bringing it back
into the RBA’s target band from there could be more
challenging.
Indeed, as the common global inflation shock wanes,
leading to disinflation (or even deflation) in goods prices,
domestic factors will become increasingly important.
Wage growth will be key – though not the only factor – but
to date has not accelerated to a rate that is clearly
inconsistent with inflation returning to the target band.
The depreciation of the exchange rate presents some
upside risk, though the passthrough is typically slow while
the disinflation in global goods is likely a larger driving
force.
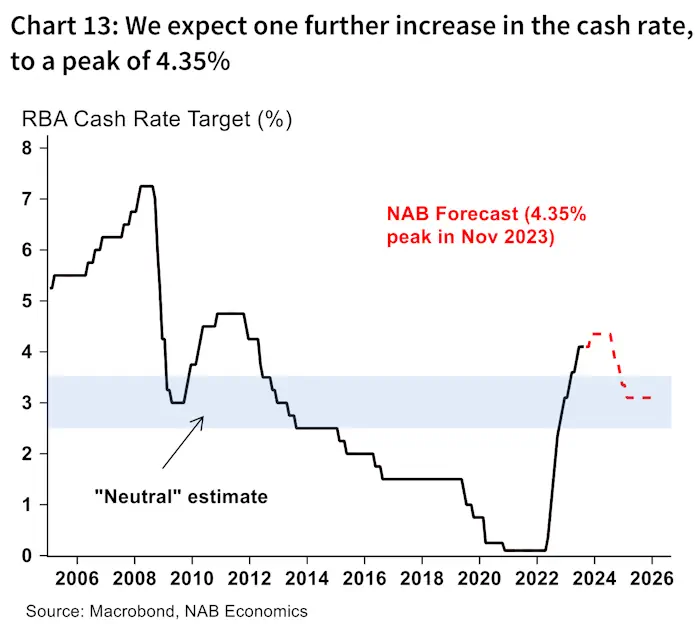
For rates, we continue to see the RBA hiking a further
25bps in November, before staying on hold until the
second half of 2024.
The RBA remained on hold in October for the fourth
consecutive month and made very few changes to the
post meeting statement.
The RBA reiterated that rates continue to slow the
economy (“working to establish a better balance of supply
and demand”) and that “they will continue to do so”.
Therefore, while inflation remains high, the RBA sees rates
in restrictive territory and that it is on track to return to the
target band by 2025. That said, the risk remains that a
prolonged period of above-target inflation poses the risk
of high inflation expectations becoming ingrained and a
larger cost of even slower growth and higher
unemployment to bring it back to target.
Ultimately, we see the Q3 CPI pushing the RBA –
particularly with services inflation remaining strong – to
provide some further insurance in balancing the risks.
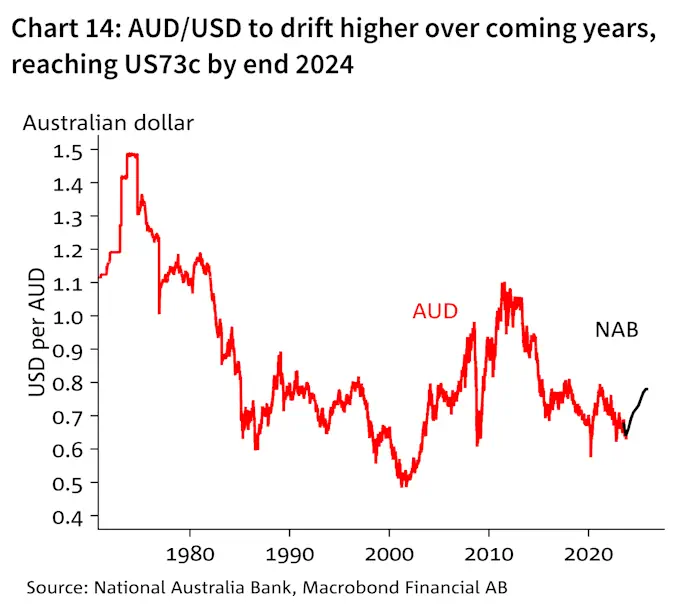
The AUD/USD weakened further over the month,
currently trading around US63c and at times lower.
We continue to see the Aussie ending the year at around
US66c before tracking higher over 2024 – ending 2024 at
around US73c.
Theme of the Month: The Stark Deterioration in Housing Affordability
Despite the rapid rise in interest rates over the past
year, which has seen a reduction in borrowing power of
over 30%, house prices have remained resilient – and
indeed they have already reversed a large proportion
of the initial ~10% fall.
This combination of higher prices and higher mortgage
servicing costs (which typically move in opposite
directions) has led to a sharp deterioration in housing
affordability.
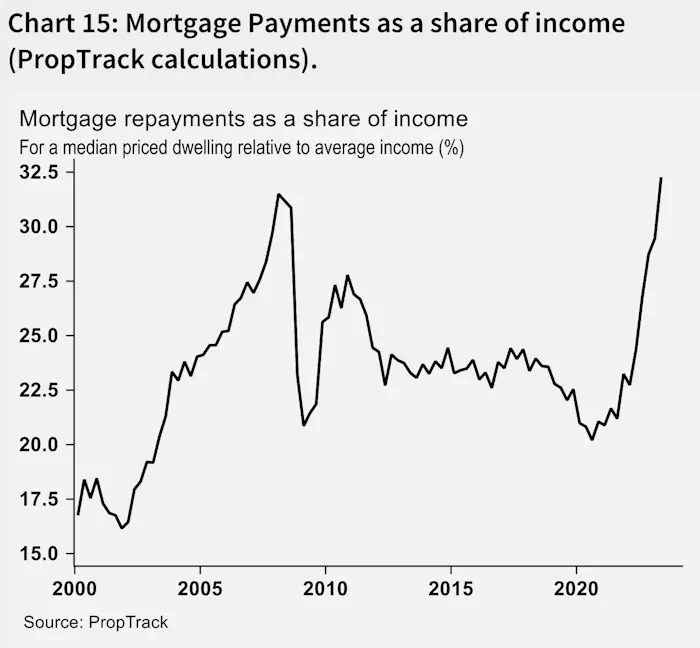
Most housing affordability measures summarise this
impact at aggregate level by calculating the share of
income spent by a household earning an average income
on the median priced property. According to PropTrack
calculations this measure has risen to around 33% of
income from a 20-year low in 2020 of around 20%. This
figure is closer to around 40% in NSW where Sydney house
prices remain a step above the other capitals. It is around
35% in Victoria and South Australia and around 30% in
Queensland.
However, the typical household (i.e. the average) is far
from common and there is a large distribution of both
incomes and property prices, with the analysis sensitive to
both binding assumptions.
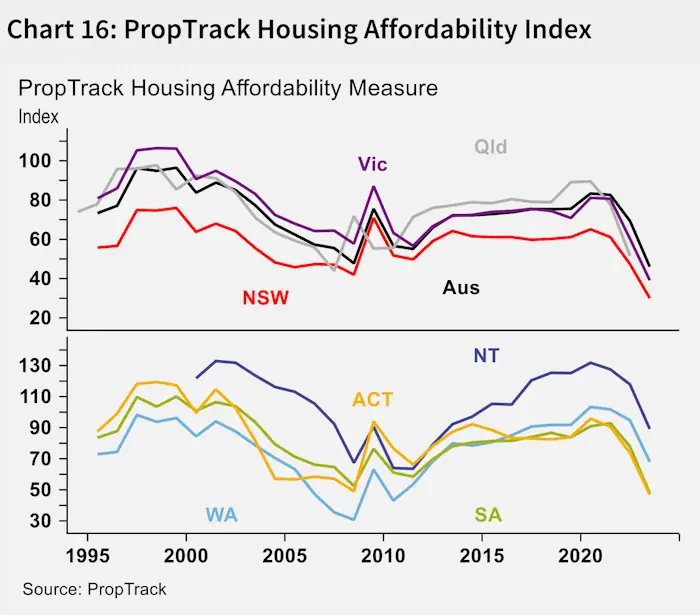
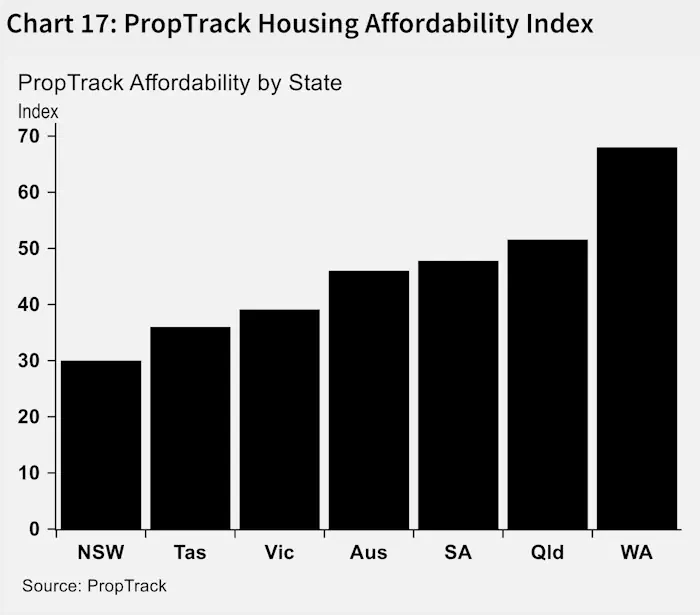
PropTrack’s new affordability index captures a broader set
of market dynamics, framing affordability as the share of
recent house sales that a median income household could
afford to buy (assuming a long run preference of 25% of
gross income is spent on housing).
This measure has deteriorated sharply over the past year
or so, falling to its lowest level since the mid-1990s (based
on available data). This pattern is common across the
states though there is some variation in the level of
affordability. Affordability is below the national average in
NSW, Tas and Vic. Above the national average in SA and
Qld – and highest in WA.
The deterioration in housing affordability is one factor
adding to the cost-of-living pressures faced by households
at the current juncture. Rents growth has also been high
and the time to save a deposit metrics also points to a
weakening in accessibility – with the time to save for a
deposit rising to very high levels.
While higher interest rates have driven a large proportion
of the deterioration in affordability over the past year,
housing supply over the long term will remain a critical
factor amidst a relatively fast-growing population, while
the impact rates will continue to be cyclical.
Group Economics
Alan Oster
Group Chief Economist
+(61 0) 414 444 652
Jacqui Brand
Executive Assistant
+(61 0) 477 716 540
Dean Pearson
Head of Behavioural &
Industry Economics
+(61 0) 457 517 342
Australian Economics
and Commodities
Gareth Spence
Senior Economist
+(61 0) 422 081 046
Brody Viney
Senior Economist
+(61 0) 452 673 400
Behavioural &
Industry Economics
Robert De Iure
Senior Economist –
Behavioural & Industry
Economics
+(61 0) 477 723 769
Brien McDonald
Senior Economist –
Behavioural & Industry
Economics
+(61 0) 455 052 520
International
Economics
Tony Kelly
Senior Economist
+(61 0) 477 746 237
Gerard Burg
Senior Economist –
International
+(61 0) 477 723 768
Global Markets
Research
Ivan Colhoun
Chief Economist
Corporate & Institutional
Banking
+(61 2) 9293 7168
Skye Masters
Head of Markets Strategy
Markets, Corporate &
Institutional Banking
Important notice
This document has been prepared by National Australia Bank Limited ABN 12 004 044 937 AFSL 230686 (“NAB”). Any advice
contained in this document has been prepared without taking into account your objectives, financial situation or needs.
Before acting on any advice in this document, NAB recommends that you consider whether the advice is appropriate for
your circumstances.
NAB recommends that you obtain and consider the relevant Product Disclosure Statement or other disclosure document,
before making any decision about a product including whether to acquire or to continue to hold it.
Please click here to view our disclaimer and terms of use